

The fastest way to learn how to write a lab report is to treat it as a short argument backed by your own data. You state what you set out to test, explain what theory predicts, describe how you measured it, present the numbers, then explain how closely they agree and why they don’t agree exactly. Every section of the standard structure serves one of those jobs.
This guide walks through each section with a running example, using example data from a typical first-year engineering lab: the midspan deflection of a simply supported steel bar under a central point load, compared with the beam formula δ = PL³/48EI. The data, results table, graph, results paragraph, discussion paragraph and abstract are all worked in full, so you can see the standard you are aiming for. You can check the theory side of your own beam test with the free beam calculator.
What a lab report is for
A lab report tells a reader who wasn’t in the lab what you did, what you found and how far the result can be trusted. Write for a classmate who missed the session: they know the theory from lectures but have never seen your set-up or your numbers. If they could repeat your test from the method and check your conclusion against your results, the report works.
Spend your effort where it counts: numbers that are right and clearly presented, and a discussion that explains the gap between measurement and theory with specific, quantified reasons. A polished introduction can’t rescue a weak discussion.
How to write a lab report: the standard structure
Most engineering and science units use the same sequence, sometimes with theory folded into the introduction. The word counts below are typical for a report of about 2,000 words; your unit outline always wins.
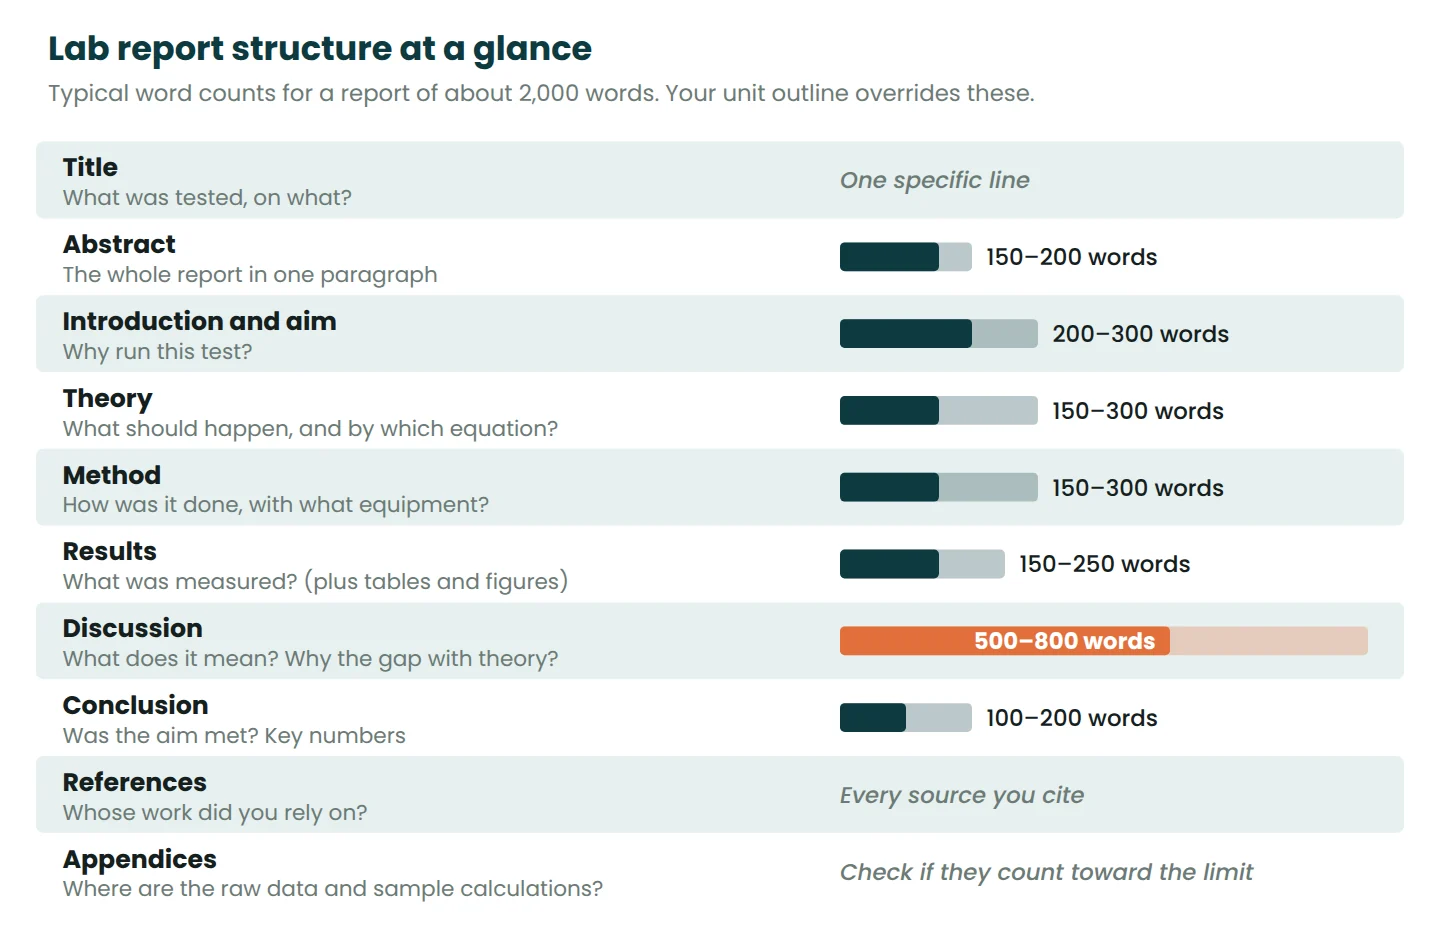
| Section | What goes in it | Rough length |
|---|---|---|
| Title | What was tested, on what, under what load or condition. | One line |
| Abstract | Aim, method, key numbers and what you concluded. Written last. | 150 to 200 words |
| Introduction and aim | Why the test matters, the background a reader needs, and the aim in one sentence. | 200 to 300 words |
| Theory | The equations you will compare against, with every symbol and unit defined. | 150 to 300 words |
| Method | Equipment (with instrument resolution) and what was done, in the past tense. | 150 to 300 words |
| Results | Tables and figures, plus a short paragraph stating the key findings without explaining them. | 150 to 250 words |
| Discussion | Comparison with theory in numbers, sources of error ranked by size, improvements. | 500 to 800 words |
| Conclusion | Answers the aim with the key numbers. Nothing new. | 100 to 200 words |
| References | Every source cited in the text, in the required style. | As needed |
| Appendices | Raw data sheets and one full sample calculation. | As needed |
The running example: a beam deflection test
Title: Midspan deflection of a simply supported steel flat bar under a central point load.
Aim: To measure the midspan deflection of a steel flat bar under increasing central loads and compare it with the prediction of elastic beam theory.
An aim like this is specific and testable. “To learn about beams” is not an aim, because no result could ever show it was met.
Theory section, with a worked calculation
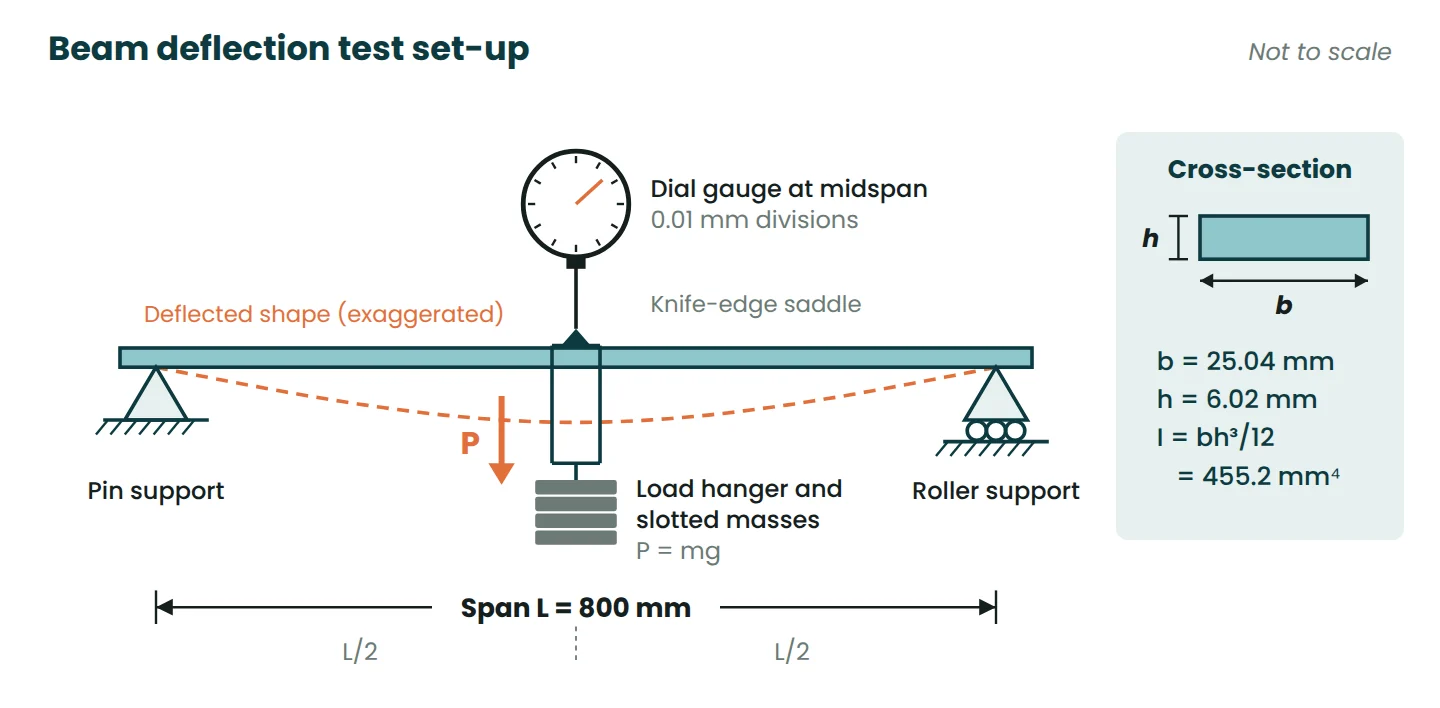
For a simply supported beam with a point load P at midspan, elastic theory gives the maximum deflection as δ = PL³ / (48EI), where L is the span, E the elastic modulus and I the second moment of area. For a rectangular section of width b and depth h, I = bh³ / 12. Number your equations in the report and define every symbol with its unit the first time it appears.
For the test bar, b = 25.04 mm and h = 6.02 mm (each the mean of three vernier readings), L = 800 mm and E is taken as the nominal 200 GPa (200 000 MPa) for steel:
I = 25.04 × 6.02³ / 12 = 455.2 mm⁴- Largest load: 2.5 kg, so
P = 2.5 × 9.81 = 24.525 N, reported as 24.5 N δ = 24.525 × 800³ / (48 × 200 000 × 455.24) = 2.87 mm
Working in newtons, millimetres and megapascals (N/mm²) keeps the units consistent, so the answer comes out directly in millimetres. A quick check that the bar stays elastic is worth a sentence too: the peak bending stress at 24.5 N is σ = (PL/4)(h/2)/I = 32 MPa, far below the yield stress of any structural steel.
Method
Write the method as a past-tense account, not a copy of the lab sheet’s instructions. Name each instrument with its resolution, because the discussion will rely on it. For example:
The width and depth of the bar were measured at three points with vernier calipers (resolution 0.02 mm). The bar was placed on knife-edge supports 800 mm apart, measured with a steel rule (1 mm). A dial gauge (0.01 mm) was set at midspan and zeroed with the empty hanger in place. Masses were added in 0.5 kg steps to 2.5 kg and the gauge was read at each step, then removed in the same steps to record unloading.
Zeroing with the hanger in place means the self-weight of the bar and hanger is excluded, which matches the theory: P is the added load only. Small details like that belong in the method because they change how the numbers should be read.
Results: tables, graphs and the results paragraph
Present the data first, then a short paragraph that points the reader at the key numbers. The results section reports; it doesn’t explain. That job belongs to the discussion.
Table 1. Measured and theoretical midspan deflection of the steel bar
| Mass (kg) | Load, P (N) | δ loading (mm) | δ unloading (mm) | Mean δ (mm) | Theory δ (mm) | Difference (%) |
|---|---|---|---|---|---|---|
| 0.0 | 0 | 0.00 | 0.02 | 0.010 | 0.000 | n/a |
| 0.5 | 4.91 | 0.61 | 0.63 | 0.620 | 0.575 | 7.8 |
| 1.0 | 9.81 | 1.21 | 1.23 | 1.220 | 1.149 | 6.2 |
| 1.5 | 14.7 | 1.80 | 1.82 | 1.810 | 1.724 | 5.0 |
| 2.0 | 19.6 | 2.41 | 2.42 | 2.415 | 2.299 | 5.0 |
| 2.5 | 24.5 | 3.01 | 3.01 | 3.010 | 2.873 | 4.8 |
Loads are shown to three significant figures because g was taken as 9.81 m/s². The theoretical values were calculated from the unrounded loads and rounded at the end.
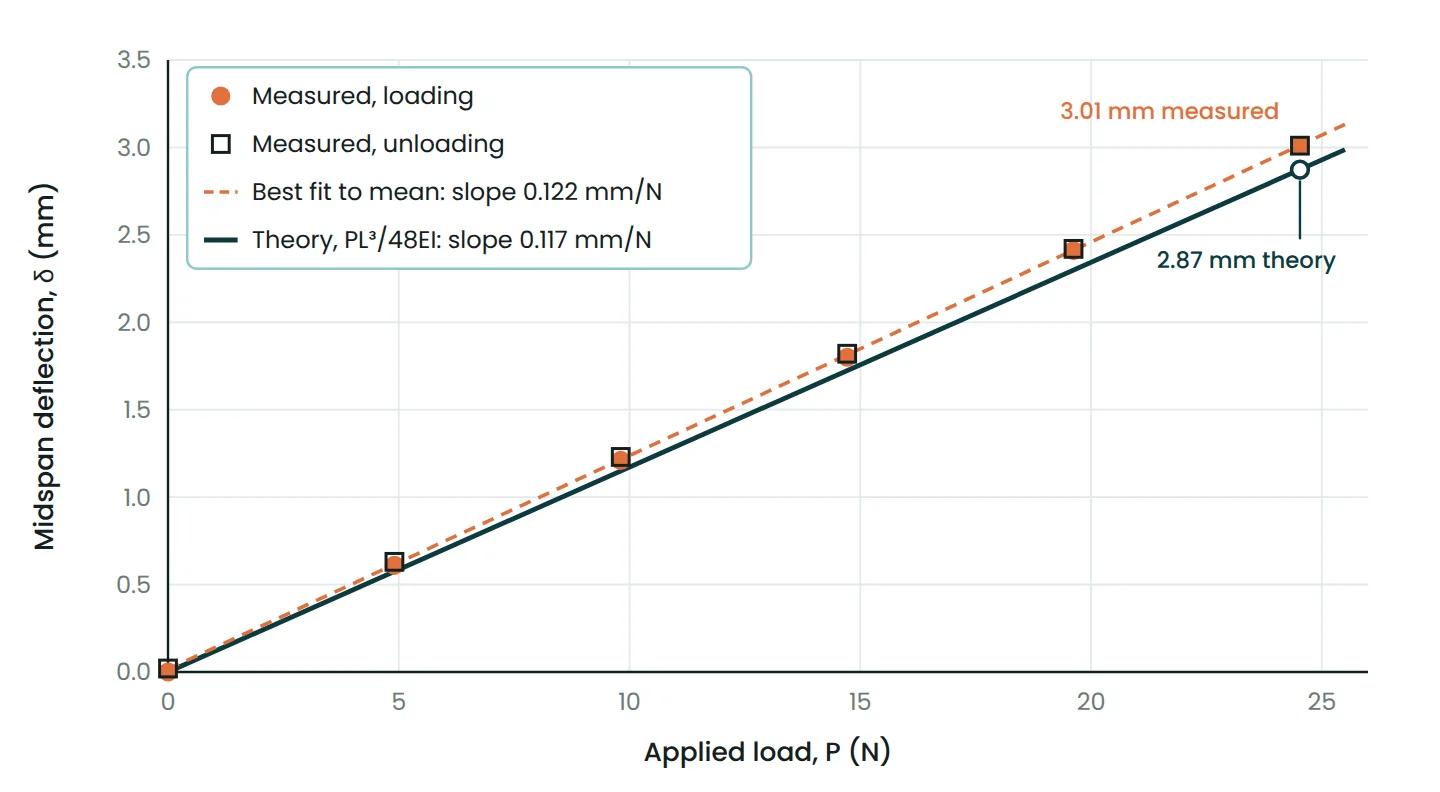
The graph plots load (the variable you controlled) on the horizontal axis and deflection on the vertical axis, shows measured values as points and theory as a line, and fits a straight line to the measurements instead of joining the dots. The best-fit line through the mean readings has a slope of 0.1222 mm/N with an intercept of 0.016 mm (R² > 0.999). Here is a results paragraph built from those numbers:
Table 1 lists the dial gauge readings. Deflection increased linearly with load on both loading and unloading (Figure 2), and the two sets of readings agreed within 0.02 mm. A least-squares line through the mean readings had a slope of 0.122 mm/N (R² > 0.999), compared with a theoretical slope of 0.117 mm/N. At the maximum load of 24.5 N, the mean deflection was 3.01 mm, 4.8% more than the predicted 2.87 mm.
The discussion: comparing with theory
A strong discussion does four things in order: states how well the results match theory, puts a number on each possible cause, rules causes in or out, and suggests what would improve the test. Two calculations make this one convincing.
First, back-calculate the modulus from the measured slope: E = L³ / (48 I × slope) = 800³ / (48 × 455.24 × 0.12218) = 191 800 MPa ≈ 192 GPa, about 4% below the nominal 200 GPa. Second, check how much the measuring tools could explain. Depth is cubed in I, so the ±0.02 mm resolution on a 6.02 mm depth gives ±1.0% in the predicted deflection, and ±1 mm on an 800 mm span gives ±0.4%. Together that is about 1.4%, well short of the 4.3% gap.
The bar was consistently more flexible than elastic theory predicted. The measured slope was 4.3% above the theoretical value, equivalent to an elastic modulus of 192 GPa rather than the nominal 200 GPa. Dimensional uncertainty accounts for at most about 1.4% of this difference. The percentage difference was largest at the lowest load (7.8% at 4.91 N, against 4.8% at 24.5 N), and the gauge read 0.02 mm after unloading; both point to seating of the knife-edge supports, a fixed offset that matters most when deflections are small. Friction at the roller would make the bar appear stiffer, not more flexible, so it is unlikely to be a main cause. The remaining difference may come from the modulus itself, since 200 GPa is a nominal value rather than a measured property of this bar. Repeating the test after a pre-load cycle to seat the supports, and measuring E for the bar in a tensile test, would separate these two effects.
Notice what is missing: “human error”. Name the actual mechanism, estimate its size and say which way it pushes the result. Also notice the comparison uses the slope rather than single points, because a small fixed offset inflates the percentage error at low loads.
A sample abstract
Write the abstract last, as one paragraph that would make sense to someone who reads nothing else. Include the numbers.
The midspan deflection of a simply supported steel flat bar (25.04 mm × 6.02 mm, span 800 mm) was measured under central point loads from 0 to 24.5 N and compared with elastic beam theory, δ = PL³/48EI, using a nominal elastic modulus of 200 GPa. Deflection increased linearly with load (R² > 0.999), and loading and unloading readings agreed within 0.02 mm. The measured load-deflection slope was 0.122 mm/N, 4.3% steeper than the theoretical 0.117 mm/N, giving a back-calculated modulus of 192 GPa. This difference exceeds the effect of dimensional uncertainty (about 1.4%) and is attributed mainly to seating at the supports and to the nominal value of E. Elastic beam theory predicted the load-deflection slope to within 5%.
Tense, voice, captions and units
Use the past tense for what you did and found, and the present tense for things that are generally true and for what your results show.
| Where | Tense | Example |
|---|---|---|
| Introduction and theory | Present | Elastic theory predicts that deflection is proportional to load. |
| Method | Past | The bar was placed on supports 800 mm apart. |
| Results | Past | Deflection increased linearly with load. |
| Discussion | Present for interpretation, past for events | The offset suggests seating of the supports, which occurred at the first load step. |
Engineering reports have traditionally used the passive voice (“the bar was loaded”), though many lecturers now accept “we loaded the bar”. Check your unit’s preference and stay consistent.
Number tables and figures separately and refer to each one in the text before it appears. The usual convention, set out in Purdue OWL’s handbook on report formats, is that table numbers and titles go above the table and figure numbers and captions go below the figure. Put units in column headings and axis labels, as in “Load, P (N)”, so the cells hold only numbers.
For significant figures, record each reading to the resolution of the instrument (1.21 mm on a 0.01 mm gauge, not 1.2 mm), carry full precision through your calculations and round only the final answer. Report a derived value to the precision your data support: E = 192 GPa, not 191 772.38 MPa. Leave a space between a number and its unit symbol (800 mm, 24.5 N), as the NIST guide to the SI sets out, and never pluralise unit symbols.
Lab report checklist
| Section | Check before you submit |
|---|---|
| Title | Names the specimen and the test, not just “Lab 3”. |
| Abstract | Contains the aim, method, key numbers and conclusion; written last; within the limit. |
| Introduction | Explains why the test matters; aim stated in one sentence. |
| Theory | Equations numbered; every symbol defined with its unit. |
| Method | Past tense; instrument resolutions given; enough detail to repeat the test. |
| Results | Every table and figure numbered, captioned and referred to; units in headings; no explanation yet. |
| Discussion | Compares with theory in numbers; each error source named, sized and given a direction. |
| Conclusion | Answers the aim with numbers; nothing new. |
| References | Every citation matches an entry in the required style. |
| Appendices | Raw data sheet and one full sample calculation. |
Common mistakes
- A method written as instructions. “Place the bar on the supports” is the lab sheet. Your report says what was done.
- Explaining in the results. Keep causes and comparisons for the discussion.
- “Human error” as the main source of error. Name the mechanism, estimate its size and its direction.
- Judging agreement from one point. Compare slopes or fitted values, not the first reading, where a small offset gives a large percentage.
- Spurious precision. Eight digits copied from a spreadsheet tell the marker you haven’t thought about uncertainty.
- Weak graphs. Missing units, dots joined instead of a fitted line, or a spreadsheet chart title in place of a numbered caption.
- A conclusion that adds new material or never returns to the aim.
- Sharing words with your lab partners. Groups usually share data; the writing must be your own unless your unit says otherwise.
Before you submit, check the length with the word counter, build your reference list with the citation generator and check it against our APA 7 referencing examples. If your lab involved a beam, run your section and span through the beam calculator as an independent check on your theory values.
Frequently asked questions
How long should a lab report be?
As long as your unit outline says, and no longer. Within that limit, give the discussion the most space, keep the results text short and move raw data to an appendix.
What is the difference between the results and the discussion?
The results state what you measured; the discussion explains what it means. “Deflection was 4.8% above theory” is a result. “This is likely due to seating at the supports” is discussion.
Should a lab report be written in first person?
It depends on your unit. The passive voice is traditional in engineering, but many lecturers accept active first-person sentences such as “we measured”. Whichever you use, use it consistently.
What goes in the appendix of a lab report?
Your raw data sheet, one full sample calculation and anything else a marker might want to check but doesn’t need to read in the body. Refer to each appendix in the text.
References
- American Wood Council. (2007). Beam formulas with shear and moment diagrams (Design Aid No. 6). https://awc.org/wp-content/uploads/2021/12/AWC-DA6-BeamFormulas-0710.pdf
- Purdue Writing Lab. (n.d.). Handbook on report formats. Purdue OWL. https://owl.purdue.edu/owl/subject_specific_writing/writing_in_engineering/handbook_on_report_formats/index.html
- The Writing Center, University of North Carolina at Chapel Hill. (2026, March 3). Scientific reports. https://writingcenter.unc.edu/tips-and-tools/scientific-reports/
- Thompson, A., & Taylor, B. N. (2008). Guide for the use of the International System of Units (SI) (NIST Special Publication 811). National Institute of Standards and Technology. https://doi.org/10.6028/NIST.SP.811e2008
This article is general information for learning. Always follow your unit outline, lab sheet and marking rubric, which take priority over any general guide.




Leave a Reply