
Ship collisions with bridges are rare, but when a large ship hits an unprotected pier the usual result is collapse, not damage. Piers are built to carry enormous loads straight down. A ship pushes sideways, and a loaded container ship moving at running pace carries as much energy as dozens of semitrailers at highway speed. An ordinary pier is not designed to resist that.
Engineers learned this in Hobart in 1975 and in Tampa Bay in 1980. The fix they settled on was not a stronger pier. It was to keep the ship away from the pier, and to keep people off the bridge when a ship goes astray. Baltimore in 2024 showed what happens when an older bridge never gets that treatment.
Below are the numbers: the energy in a moving ship, the AASHTO impact force, and the risk calculation US bridge owners are now being asked to run. The source documents mix knots, feet and kips, so keep the free engineering unit converter open as you read.
Why bridge piers are strong downwards but weak sideways
A pier’s main job is to carry the deck, the traffic and its own weight down into the foundation. Concrete is very good at that, and a large pier can carry thousands of tonnes in compression with a comfortable margin.
A ship loads the pier horizontally, near the waterline and often off-centre. The pier then acts as a vertical cantilever fixed at its footing, and the base must resist a bending moment equal to the force times its height, plus shear through the columns and pile cap. Ordinary piers are not reinforced for that, because their normal sideways loads from wind, current and braking traffic are small by comparison.
An empty drink can shows the idea. Stand on it carefully and it holds you. Tap the side and it folds. Only the direction of the load has changed.
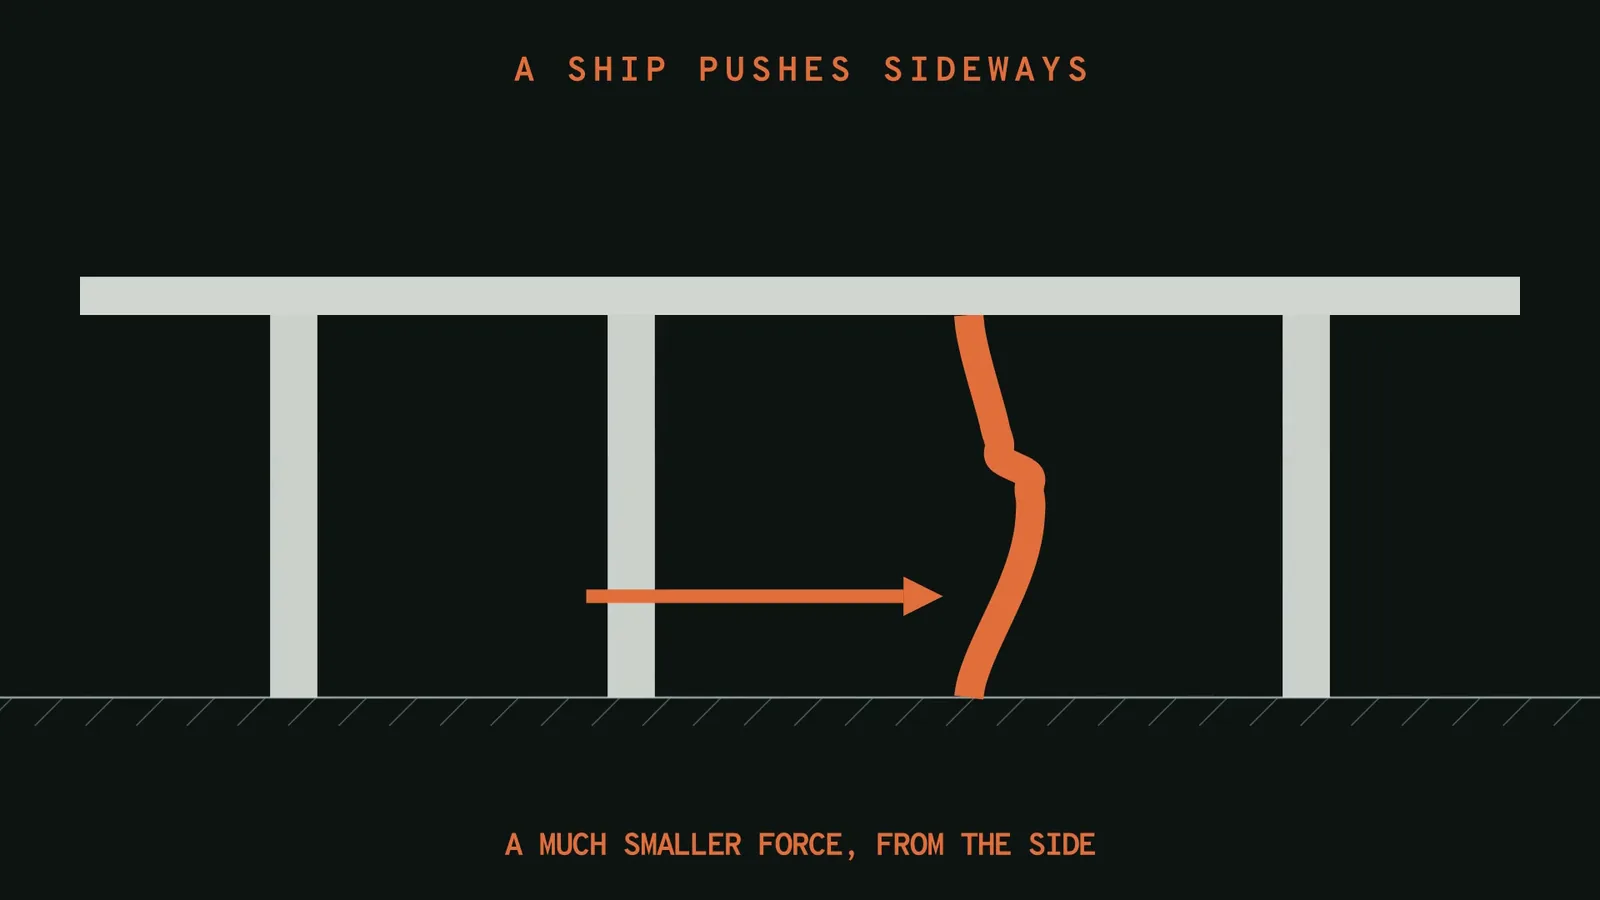
Many long-span bridges are also continuous over their piers, so losing one pier drops the spans on both sides at once. Our Key Bridge collapse analysis shows that mechanism in detail.
How much energy does a moving ship carry?
Kinetic energy is E = ½ m v². Speed is squared, but a ship’s mass is so large that even slow speeds give very large numbers.
Worked example: the Dali at the Key Bridge
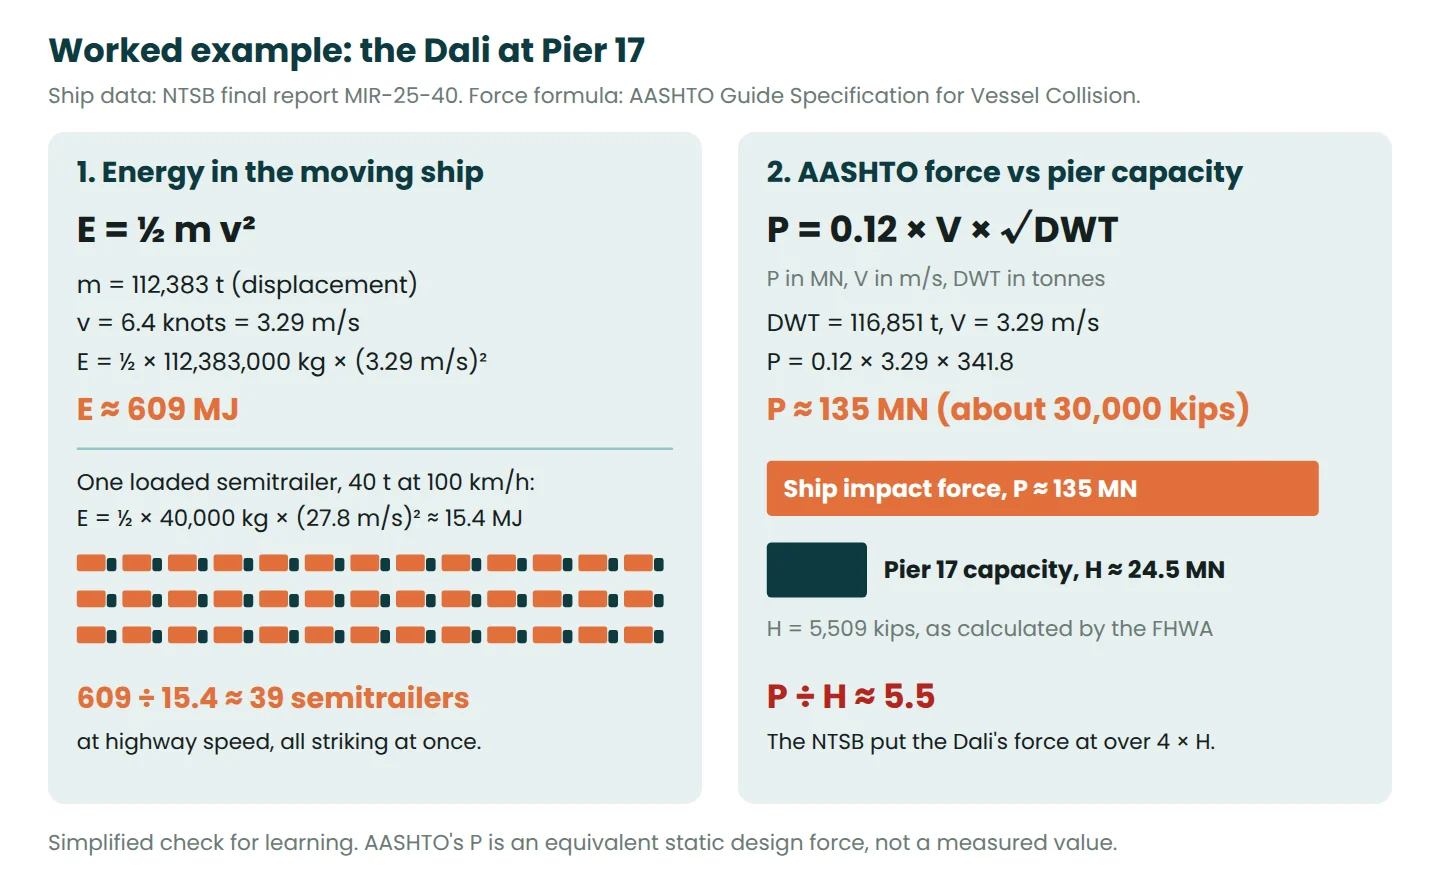
The NTSB final report gives the Dali’s displacement as 112,383 tonnes on departure and its speed at impact as 6.4 knots.
- Speed: 6.4 knots × 0.5144 = 3.29 m/s (about 11.9 km/h).
- Mass: 112,383 t × 1,000 = 112,383,000 kg.
- Energy:
E = ½ × 112,383,000 × 3.29²≈ 609,000,000 J, or about 609 MJ. - A loaded 40 t semitrailer at 100 km/h (27.8 m/s):
E = ½ × 40,000 × 27.8²≈ 15.4 MJ. - Ratio: 609 ÷ 15.4 ≈ 39.
The ship arrived with the energy of about 39 loaded semitrailers hitting one spot at highway speed. AASHTO’s energy equation also applies a hydrodynamic mass coefficient of 1.05 to 1.25 for the water moving with the hull, which lifts the figure to roughly 640 to 760 MJ.
| Moving object | Mass | Speed | Kinetic energy |
|---|---|---|---|
| Dali at Pier 17 | 112,383 t | 6.4 knots (3.29 m/s) | 609 MJ |
| Loaded semitrailer | 40 t | 100 km/h (27.8 m/s) | 15.4 MJ |
| Family car | 1.5 t | 100 km/h (27.8 m/s) | 0.58 MJ |
Energy tells you how much crushing of bow, fender or pier must happen before the ship stops. To check the pier itself, designers need a force, which comes later in this guide.
Three ship collisions with bridges, one pattern
The 1991 AASHTO guide recorded that between 1965 and 1989 the world saw, on average, one catastrophic bridge collision by a merchant ship every year. Three cases changed how bridges are designed and run.
Tasman Bridge, Hobart, 1975
At 9:27 pm on 5 January 1975 the bulk carrier Lake Illawarra, carrying about 10,000 tonnes of zinc concentrate upriver, approached the Tasman Bridge off line. A strong tidal current and inattention by the master set it towards piers 18 and 19 instead of the main navigation span. The bow struck pier 19 and the ship’s side struck pier 18. Both piers failed and three spans, 127 m of roadway, fell onto the ship.
The ship sank and seven of its crew died. In the dark, four cars drove into the gap and five people died. The Court of Marine Inquiry found the master had not handled the ship in a proper and seamanlike manner and suspended his certificate for six months. The structural lesson was just as clear: only the main navigation span piers had impact-absorbing fendering. Every other pier stood unprotected.
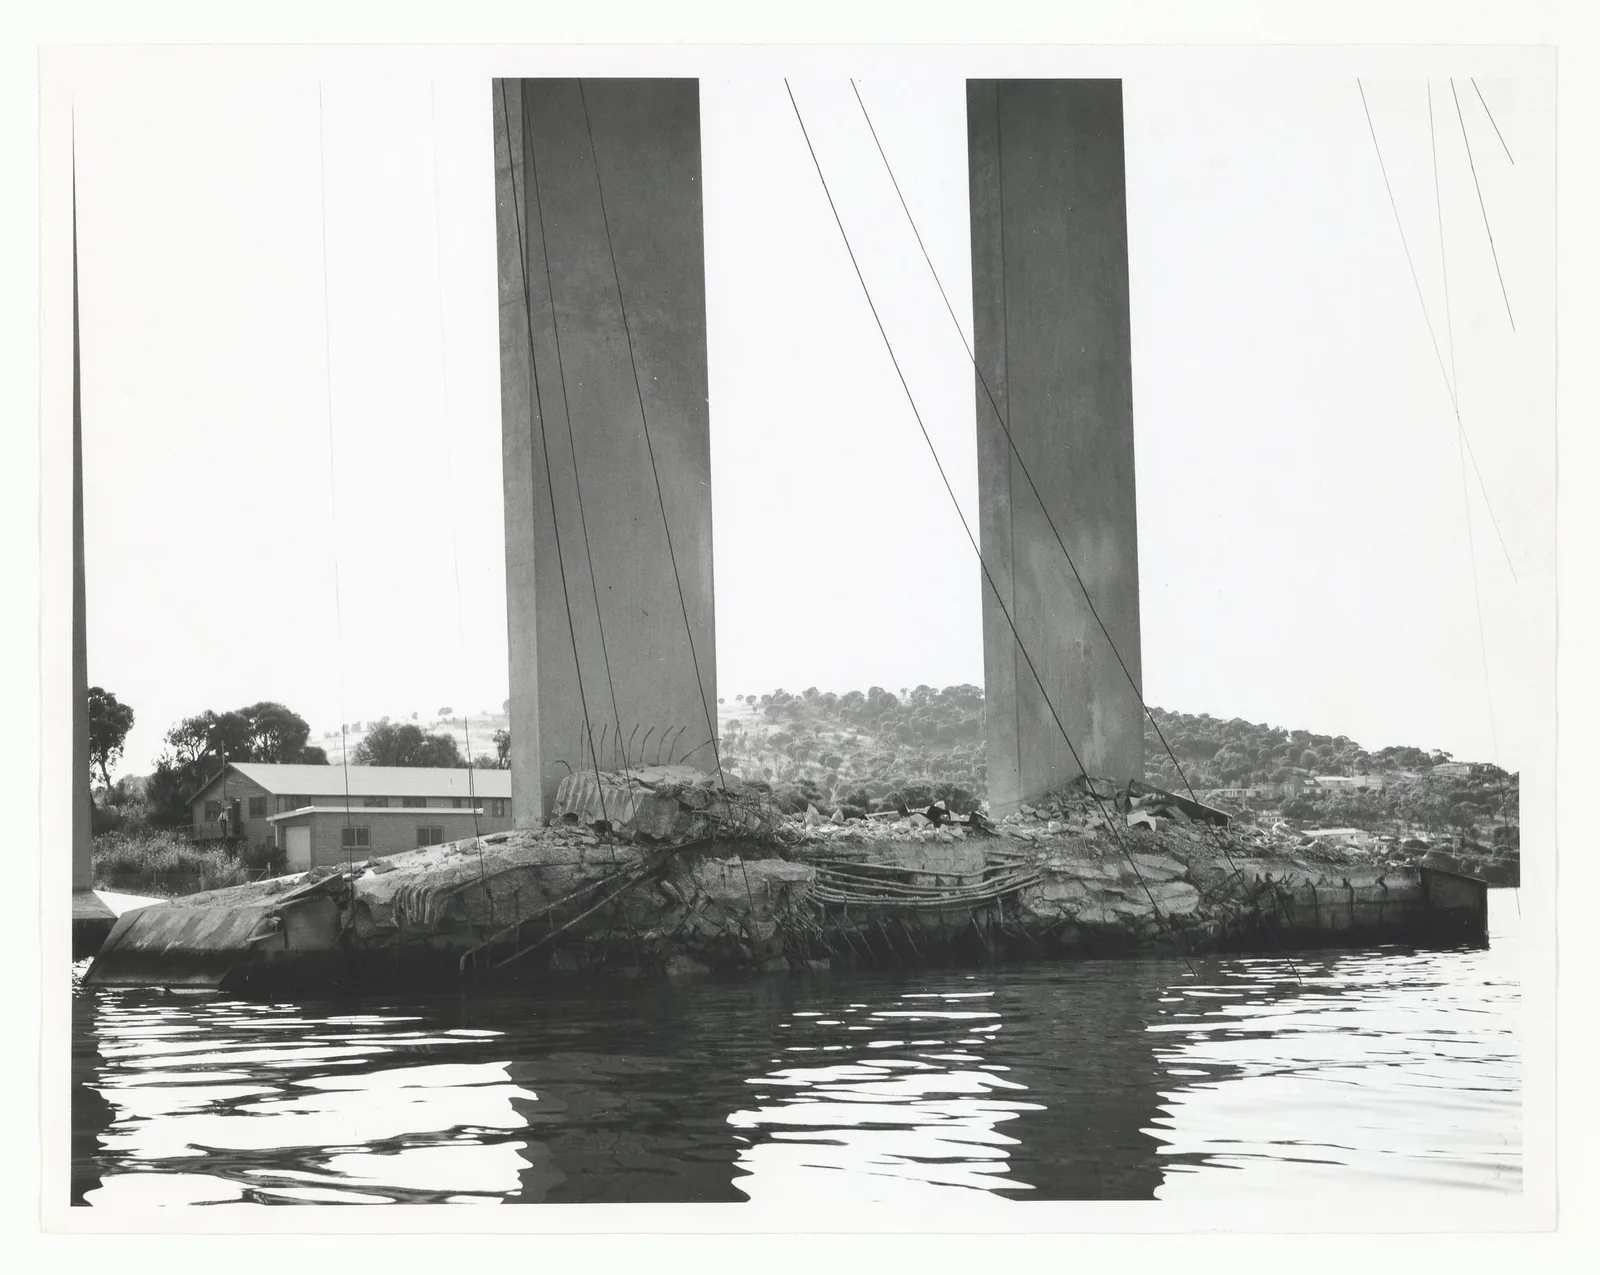
The bridge reopened in October 1977. Large ships now need a pilot and a tug in attendance, road traffic is halted while they pass under, and since 1987 sensors in the channel have measured current, tide and wind.
Sunshine Skyway, Tampa Bay, 1980
At about 7:34 am on 9 May 1980 the bulk carrier Summit Venture (186 m long, 33,912 DWT, in light ballast) was inbound when a line of severe thunderstorms overtook it. The NTSB reported winds of about 60 knots and visibility at times close to zero. With its visual and radar references lost, the ship struck pier 2S, a support pier near the main channel that had no fender system.
About 395 m (1,297 ft) of deck fell some 46 m into the bay with eight vehicles, including a Greyhound bus, and 35 people died. The NTSB found that the lack of a structural pier protection system contributed to the loss of life and asked the FHWA and the Coast Guard to develop design specifications for dolphins and fenders. That work led to the 1991 AASHTO Guide Specification.
Francis Scott Key Bridge, Baltimore, 2024
At 1:25 am on 26 March 2024 the 300 m container ship Dali lost electrical power with its bow about 975 m (3,200 ft) from the Key Bridge. Propulsion and steering went with it. At 1:29:09 it struck Pier 17 at 6.4 knots, and 13 seconds later the pier collapsed, taking the three-span continuous truss and several approach spans with it. Police had stopped traffic 48 seconds before impact, but six members of a road maintenance crew on the deck were killed. The full sequence is in our article on the Key Bridge collapse.
What the three disasters have in common
| Tasman Bridge, 1975 | Sunshine Skyway, 1980 | Key Bridge, 2024 | |
|---|---|---|---|
| Ship | Lake Illawarra, bulk carrier | Summit Venture, bulk carrier, 186 m | Dali, container ship, 300 m |
| Trigger | Off line in a strong current | Severe storm, near-zero visibility | Electrical blackout |
| Pier struck | Piers 18 and 19, outside the navigation span | Pier 2S, near the main channel | Pier 17, a main span pier |
| Protection on that pier | None | No fender system | Fender; dolphins 149 m away, not touched |
| Roadway lost | 127 m (three spans) | About 395 m | Three truss spans and northern approach spans |
| Deaths | 12 | 35 | 6 |
The trigger was different every time: a current, a storm, a loose wire. The outcome was the same because a ship of that size could reach a pier that could not resist it. Nobody can design out every pilot error, squall or electrical fault, so modern practice assumes some ships will go astray and designs the bridge for that day.
How engineers design bridges for ship collision since 1991
In the United States the method is the AASHTO Guide Specification and Commentary for Vessel Collision Design of Highway Bridges (1991, second edition 2009), also reflected in Article 3.14 of the AASHTO LRFD Bridge Design Specifications. Europe treats ship impact as an accidental action in EN 1991-1-7. Method I is a simpler semi-deterministic check, Method II is a probability-based risk analysis used for most bridges including all critical ones, and Method III adds a cost-effectiveness study.
Choosing the design vessel
Every pier and span a ship could reach gets a design vessel. Under Method I it is chosen so that only a few larger ships pass each year: no more than 50 passages or 5 per cent of traffic for a critical bridge, and 200 passages or 10 per cent for a regular bridge. The design speed is the typical transit speed near the channel, reducing for piers further out to the yearly mean current at three ship lengths from the centreline of the transit path.
Worked example: the AASHTO ship impact force
AASHTO converts ship size and speed into an equivalent static force on the pier. In SI units, P = 0.12 × V × √DWT, with P in MN, V in m/s and DWT the deadweight tonnage in tonnes. The US form is P = 220 × √DWT × (V ÷ 27) in kips with V in ft/s, which simplifies to 8.15 × V × √DWT. It is based on Woisin’s model tests of ship collisions and uses the 70 per cent fractile of the measured forces.
For the Dali, with a deadweight of 116,851 t, at 6.4 knots:
- √DWT = √116,851 = 341.8
- V = 6.4 × 0.5144 = 3.29 m/s
P = 0.12 × 3.29 × 341.8≈ 135 MN, about 13,800 tonnes-force.- US check: V = 10.8 ft/s, so
P = 8.15 × 10.8 × 341.8≈ 30,100 kips ≈ 134 MN. The small difference comes from rounding the SI constant to 0.12. - Pier 17’s lateral capacity, as calculated by the FHWA, was 5,509 kips (24.5 MN): 135 ÷ 24.5 ≈ 5.5.
The NTSB put the Dali’s estimated force at over four times Pier 17’s capacity, which agrees with this simple check. Strengthening an existing pier to close a gap of that size is rarely practical.
Note the square root. Four times the deadweight gives only twice the force, while speed counts in full. At 6 knots:
| Deadweight (DWT) | Example | Force P at 6 knots (3.09 m/s) |
|---|---|---|
| 10,000 t | Small general cargo ship | 37 MN |
| 33,912 t | Summit Venture (1980) | 68 MN |
| 116,851 t | Dali (2024) | 127 MN |
| 240,000 t | A very large modern ship | 181 MN |
Annual frequency of collapse
Method II estimates how often, on average, the bridge can be expected to collapse from ship impact. For each pier or span and each ship class, AF = N × PA × PG × PC × PF, and the results are added for the whole bridge.
| Term | Meaning |
|---|---|
| N | Ships of that class passing each year, grouped by type, size and loading condition |
| PA | Probability of aberrancy: the chance a ship goes out of control near the bridge. Base rate 0.6 × 10⁻⁴ for ships and 1.2 × 10⁻⁴ for barges, adjusted for bends, currents, cross-currents and traffic density |
| PG | Geometric probability that an errant ship is lined up with the pier, from a normal distribution centred on the transit path with a standard deviation equal to the ship’s length |
| PC | Probability of collapse if hit: zero when the pier’s lateral resistance H is at least the impact force P, rising as H/P falls |
| PF | Protection factor: 1.0 with no protection, 0 with full protection. The 1991 edition had no PF term; later editions added it |
The acceptance criteria are AF ≤ 0.0001 per year (1 in 10,000 years) for critical or essential bridges, which must keep working after an impact for emergency response or defence, and AF ≤ 0.001 (1 in 1,000 years) for typical bridges.
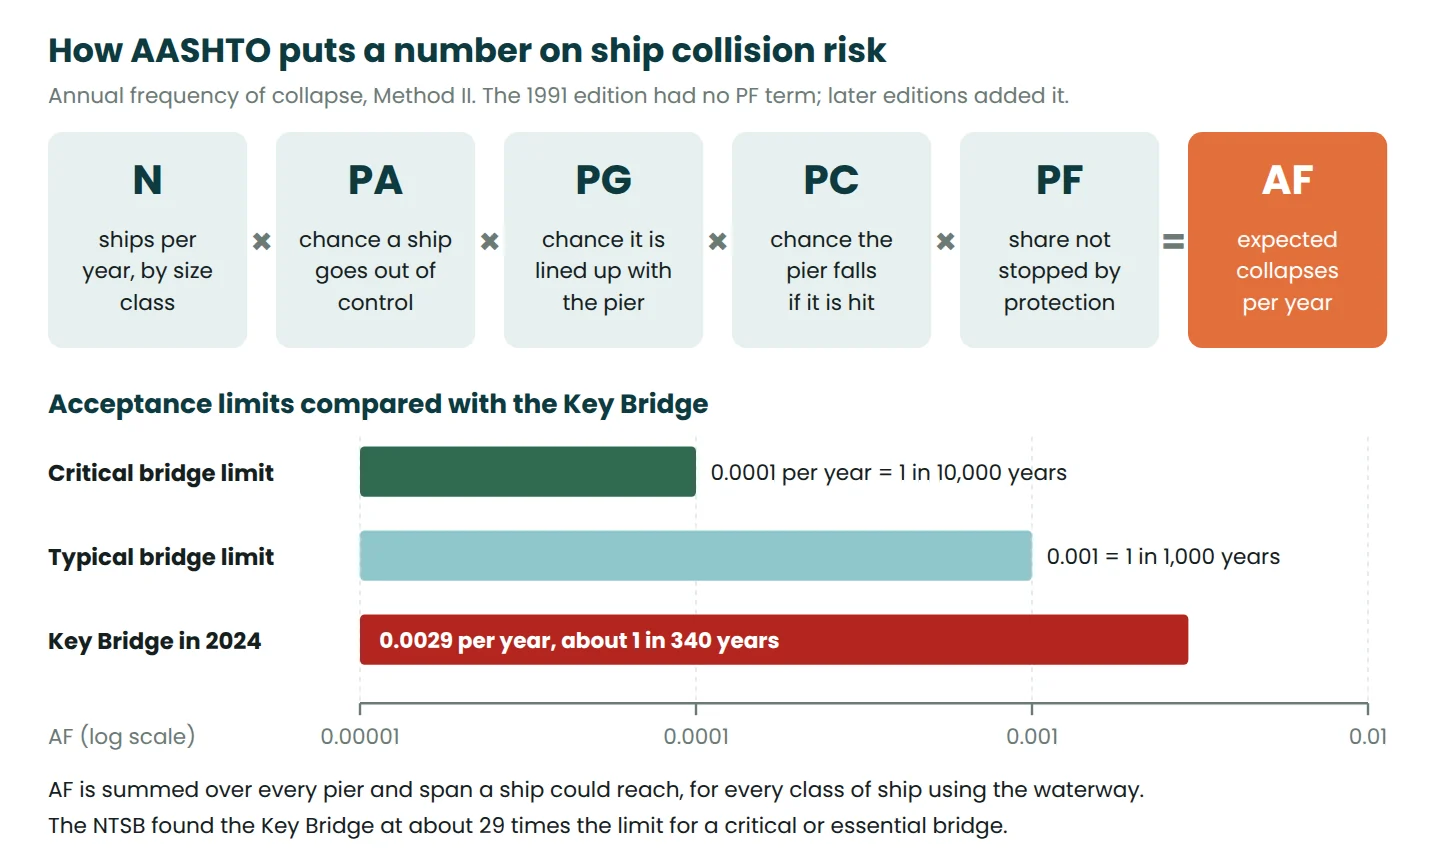
A simple illustration with assumed inputs: 2,000 passages a year of one ship class, PA = 0.6 × 10⁻⁴, PG = 0.05, PC = 0.1 and no protection give AF = 2,000 × 0.00006 × 0.05 × 0.1 = 0.0006, six times the critical limit. Protection that stops 90 per cent of impacts (PF = 0.1) brings it to 0.00006, inside the limit.
For the Key Bridge the NTSB calculated AF = 0.002921, about 29 times the limit, or one expected collapse in roughly 340 years. That sounds remote until you count how many bridges cross shipping channels. In March 2025 the NTSB asked the owners of 68 US bridges designed before this guidance, none with a current assessment, to run the calculation (NTSB report MIR-25-10).
Ships kept growing, but the bridges did not
A bridge opened in the 1960s or 1970s was planned around the ships of its day, and it stays in service for many decades while fleets change. The NTSB pointed to the 2016 Panama Canal expansion, whose new locks take ships up to 366 m long and 49 m wide, as one change that brought far larger ships to ports like Baltimore.
| Ship | Year | Length | Size |
|---|---|---|---|
| Blue Nagoya (struck Key Bridge Pier 17) | 1980 | 119 m (390 ft) | About one-tenth of the Dali’s displacement |
| Summit Venture (Sunshine Skyway) | 1980 | 186 m (609 ft) | 33,912 DWT |
| Dali (Key Bridge) | Built 2015 | 300 m (984 ft) | 116,851 DWT, about 10,000 TEU |
| MSC Irina class | 2023 | 400 m | 24,346 TEU |
The Blue Nagoya lost steering in 1980 and struck the same Pier 17. The fender stopped it and the pier escaped with minor surface damage. Forty-four years later a ship about ten times heavier hit that pier and the bridge fell.
How bridges are protected from ship strikes
There are three broad options, and good schemes combine them.
- Make the pier stronger. Reasonable for barges, small ships and new foundations. For a large container ship the force can be several times what an existing pier resists.
- Keep the ship away from the pier. Fenders absorb glancing blows. Dolphins, large circular cells filled with concrete or rock or groups of piles, take the hit in front of the pier. Artificial islands make a ship run aground first. Longer spans move piers away from the channel.
- Keep people off the bridge. Warning systems, gates and police procedures stop traffic when a ship is out of control. At the Tasman Bridge, traffic is halted whenever a large ship passes under.
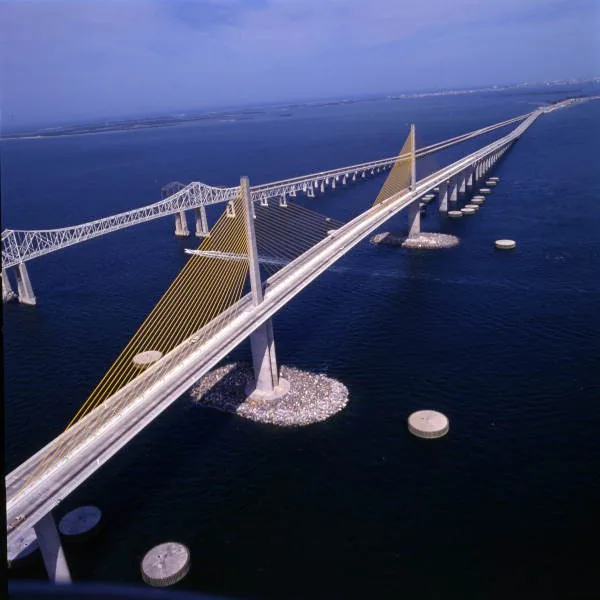
Pilotage rules, tug escorts and navigation aids reduce PA, the chance of a ship going astray at all. Our guide to bridge pier protection with fenders and dolphins covers how each option is designed.
Common mistakes when assessing ship collision risk
- Treating the trigger as the cause. Loose wires, storms and pilot errors will keep happening. Ask what the ship does to the bridge when one does.
- Protecting only the navigation span. Hobart showed that ships hit piers well away from the channel. Check every pier and span a ship can reach.
- Designing for the opening-year fleet. Reassess as ships grow. The Key Bridge had never been assessed against 2024 traffic.
- Confusing deadweight with displacement. DWT (carrying capacity) goes in the force formula; displacement (actual mass) goes in the energy equation.
- Forgetting the people on the deck. In Baltimore vehicles were stopped in time, but no warning reached the road crew.
- Mixing units. Convert kips, knots and ft/s to SI before comparing forces, for example with the engineering unit converter.
Frequently asked questions
How often do ships hit bridges?
Often enough that design codes treat ship impact as a real load case. The 1991 AASHTO guide recorded an average of one catastrophic bridge collision by a merchant ship per year worldwide between 1965 and 1989.
Why not just build stronger piers?
Because for large ships the force is usually several times what a normal pier can resist. The Dali’s AASHTO force of about 135 MN was roughly 5.5 times Pier 17’s lateral capacity, so stopping the ship before it reaches the pier is usually cheaper and safer.
What is an acceptable risk of collapse for a bridge?
Under AASHTO, the annual frequency of collapse from ship impact should not exceed 0.0001 (1 in 10,000 years) for a critical or essential bridge, or 0.001 (1 in 1,000 years) for a typical bridge.
Does the AASHTO impact force use the ship’s actual weight?
No. The force formula uses deadweight tonnage (DWT), the ship’s carrying capacity in tonnes, with the impact speed. The ship’s displacement, its actual mass, is used in the kinetic energy equation.
References
- National Transportation Safety Board (2025). Safeguarding Bridges from Vessel Strikes: Need for Vulnerability Assessment and Risk Reduction Strategies, MIR-25-10.
- National Transportation Safety Board (2025). Contact of Containership Dali with the Francis Scott Key Bridge and Subsequent Bridge Collapse, MIR-25-40.
- National Transportation Safety Board (1981). Ramming of the Sunshine Skyway Bridge by the Liberian Bulk Carrier Summit Venture, Tampa Bay, Florida, May 9, 1980, NTSB-MAR-81-3.
- AASHTO (1991). Guide Specification and Commentary for Vessel Collision Design of Highway Bridges.
- AASHTO (2009). Guide Specifications and Commentary for Vessel Collision Design of Highway Bridges, 2nd edition.
- Federal Highway Administration (2025). NTSB Francis Scott Key Bridge Investigation: Urgent Recommendations.
- Court of Marine Inquiry, Hobart (1975). Findings on the collision of the Lake Illawarra with the Tasman Bridge.
This article is general information for learning and planning. Always follow your project specification, the current standard and the advice of the responsible engineer.


Leave a Reply