

A soil compaction test answers one question: is the fill as dense as the specification asks for? The answer comes in two parts. A laboratory compaction test (the Proctor test) gives the maximum dry density (MDD) and optimum moisture content (OMC) of the material. A field density test measures the dry density of the compacted layer, and the ratio of the two is the result you report, for example “97.0% of standard MDD”.
In practice, most failed tests trace back to three things: the wrong lab reference, fill that is too dry or too wet, or layers too thick for the roller. If you are also working out fill quantities, the free earthwork calculator lets you apply a fill factor, because a cubic metre of compacted fill takes more than a cubic metre of loose material.
Why compaction is specified
Compaction pushes soil particles together and drives out air, so the soil is stronger, settles less and lets water through more slowly. Loose fill keeps compressing, and the slab or road on top cracks or dips. Under a footing, the bearing capacity you assume (for example in the bearing capacity calculator) only holds if the fill really is the dense, controlled material the design assumed. Specifications therefore set a minimum density as a percentage of a lab maximum, plus a moisture window and a maximum layer thickness.
Laboratory compaction: standard and modified Proctor
The lab compacts the same soil at four or five moisture contents in a steel mould with a drop hammer (the rammer) and measures the dry density of each specimen. Plotting dry density against moisture content gives a hump-shaped curve. The peak is the maximum dry density (MDD) and the moisture content at the peak is the optimum moisture content (OMC). Both belong to the soil and a particular compactive effort, not to the soil alone.
| Item | Standard effort | Modified effort |
|---|---|---|
| Australian Standard | AS 1289.5.1.1 | AS 1289.5.2.1 |
| ASTM | ASTM D698 | ASTM D1557 |
| Rammer (AS) | 2.7 kg, 300 mm drop | 4.9 kg, 450 mm drop |
| Layers × blows, 105 mm mould (AS) | 3 × 25 | 5 × 25 |
| Rammer (ASTM) | 24.5 N (5.5 lbf), 305 mm drop | 44.48 N (10 lbf), 457 mm drop |
| Compactive energy | 596 kJ/m³ (AS), 600 kN·m/m³ (ASTM) | 2703 kJ/m³ (AS), 2700 kN·m/m³ (ASTM) |
Modified effort puts in about 4.5 times the energy. You can check the standard figure yourself: 75 blows × 2.7 kg × 9.81 m/s² × 0.300 m ≈ 596 J into a 1 litre (0.001 m³) mould, which is 596 kJ/m³. The ASTM methods use a 101.6 mm mould with 25 blows per layer, or a 152.4 mm mould with 56 blows per layer for coarser material. The University of Texas at Arlington lab manual shows the procedure.
Reading the compaction curve and the zero-air-voids line
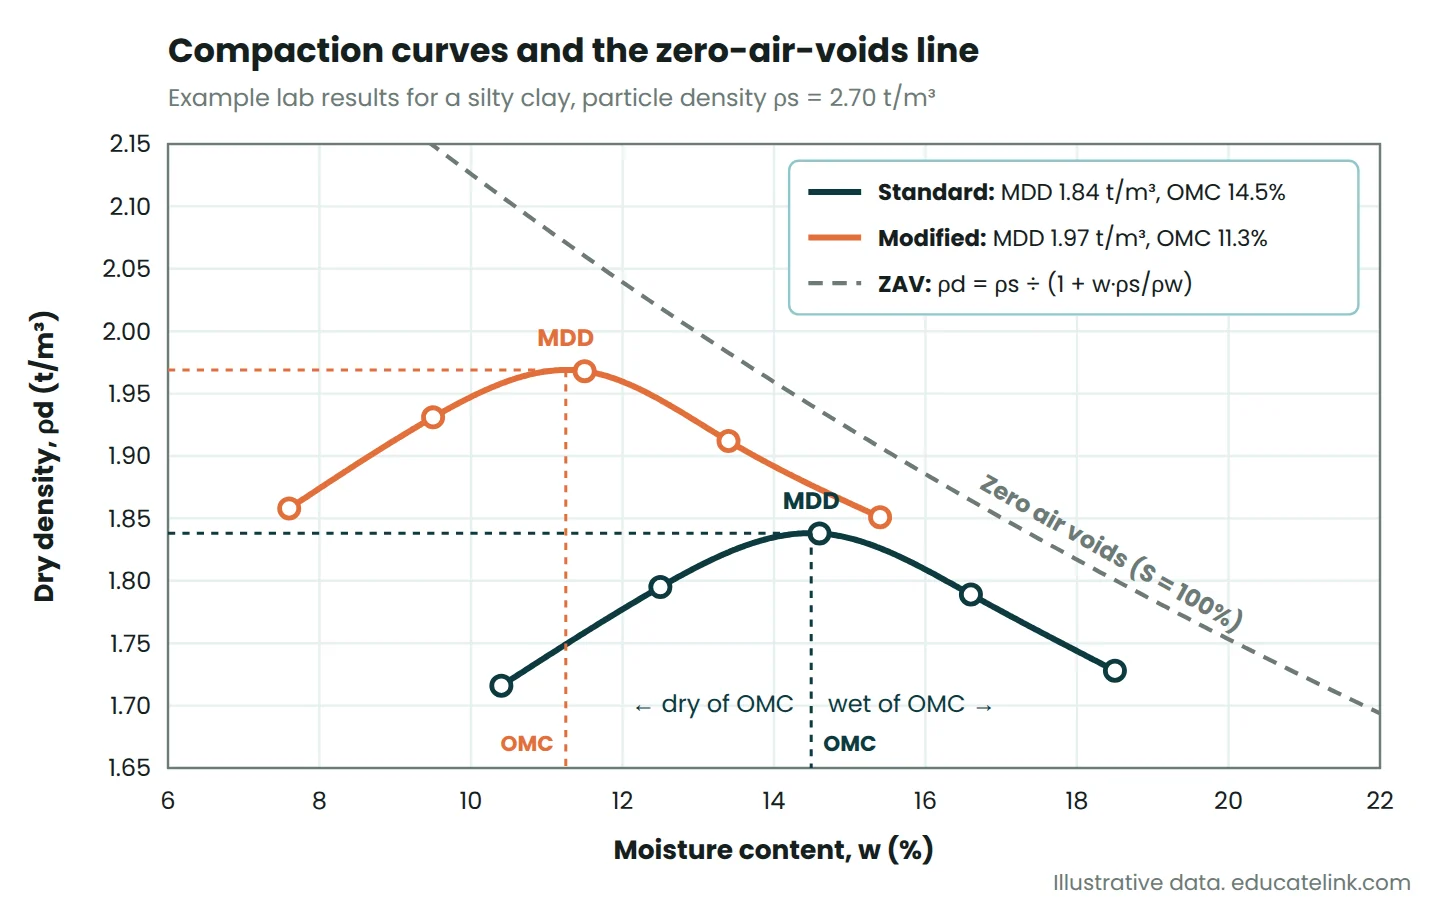
The diagram shows example results for a silty clay. Under standard effort it reaches an MDD of 1.84 t/m³ at an OMC of 14.5%. Under modified effort the same soil reaches 1.97 t/m³ at 11.3%. More energy always gives a higher MDD at a lower OMC, so “95% of modified MDD” is a harder target than “95% of standard MDD” on the same soil.
The dashed line is the zero-air-voids (ZAV) line, the dry density the soil would have if every void were full of water: ρd(ZAV) = ρs ÷ (1 + w × ρs / ρw), where ρs is particle density and ρw is the density of water. With ρs = 2.70 t/m³ at w = 14.5%, the ZAV density is 2.70 ÷ (1 + 0.145 × 2.70) = 1.94 t/m³. The MDD of 1.84 t/m³ sits below it with about 5% air voids, which is normal. No real result can plot above the ZAV line. If one does, the moisture content, mould volume or assumed particle density is wrong.
The two sides of the curve behave differently. Clay compacted dry of optimum is stiffer when placed but can swell or collapse when it later gets wet. Clay compacted a little wet of optimum is less permeable and more uniform, but softer and prone to rutting under plant. That is why specifications control moisture as well as density.
Soil compaction test methods in the field
Every field method finds two things at the test spot: the wet density of the compacted soil and its moisture content. Dry density follows from ρd = ρwet ÷ (1 + w). The methods differ in how they get volume and moisture.
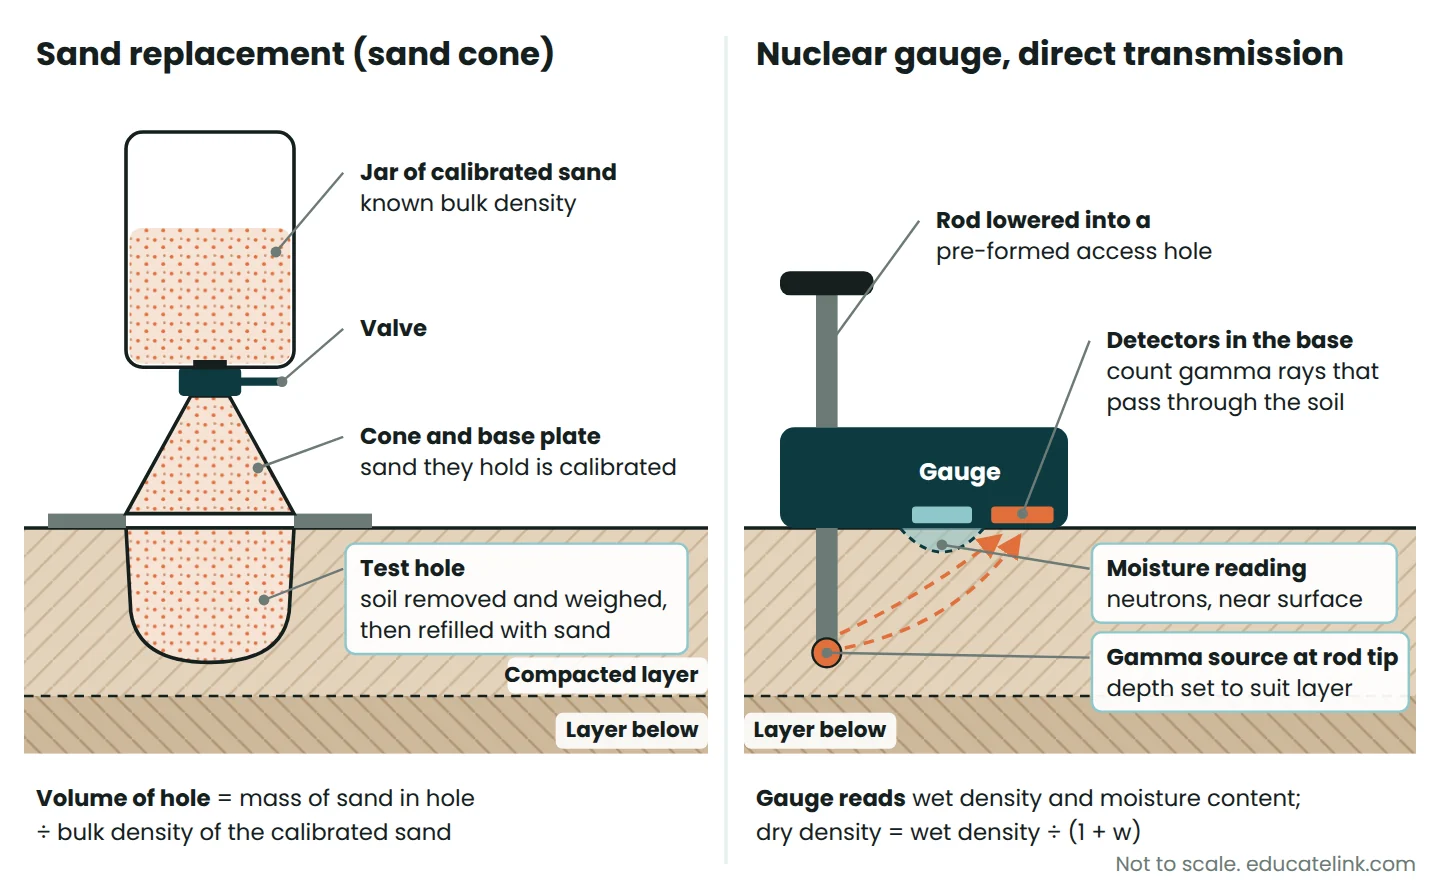
Sand replacement (sand cone): AS 1289.5.3.1 and ASTM D1556/D1556M
You dig a hole through the layer, keep and weigh all the soil that comes out, then fill the hole with dry sand of known bulk density from a jar fitted with a valve and cone. The mass of sand in the hole divided by its bulk density gives the hole volume. A sample of the soil goes in the oven for moisture content (AS 1289.2.1.1). It is slow, but it measures volume directly and needs no radioactive source. AS 1289.5.3.1 covers fine and medium-grained soils at depths of about 50 to 250 mm. ASTM D1556/D1556M excludes saturated, soft or crumbly soils and any soil whose hole walls will not stand up.
Nuclear density gauge: AS 1289.5.8.1 and ASTM D6938
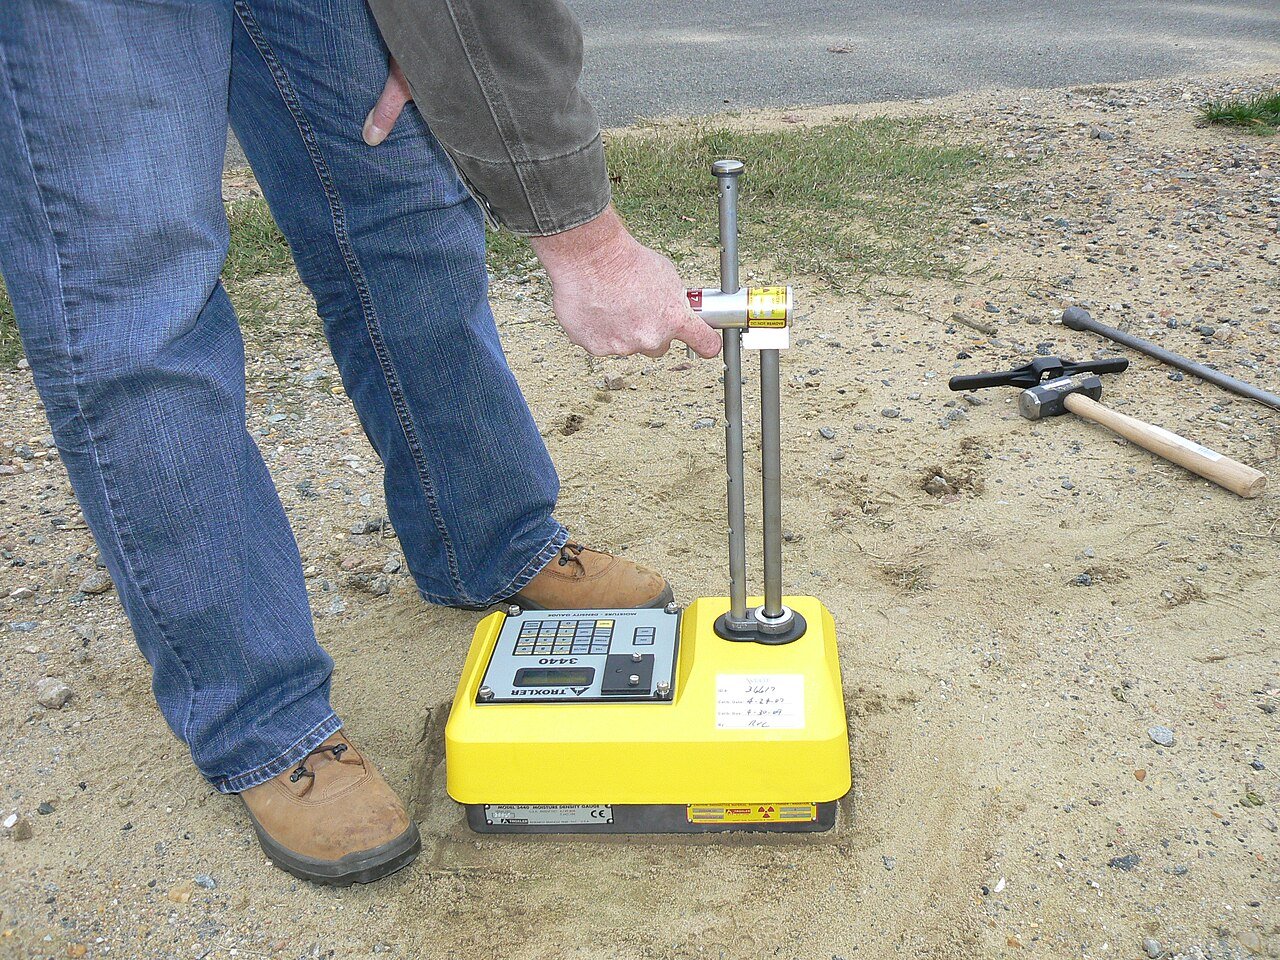
In direct transmission mode a rod holding a gamma source is lowered into a pre-formed hole, and detectors in the gauge base count the gamma rays that pass through the soil. Denser soil lets fewer through. Moisture is read near the surface with a neutron source, because hydrogen in water slows neutrons. ASTM D6938 allows direct transmission to 300 mm depth. A reading takes minutes, so the gauge does most routine testing.
Two cautions. The moisture reading responds to all hydrogen, so organic matter and some minerals bias it: check it against oven moisture on each new material. And the gauge holds radioactive sources: operators need a licence and training, and the ARPANSA code of practice for portable density/moisture gauges covers storage, transport and keeping bystanders about 3 metres back during measurement.
Density ratio and the Hilf rapid method: AS 1289.5.4.1 and AS 1289.5.7.1
In Australia the field result is reported under AS 1289.5.4.1 as a dry density ratio (field dry density ÷ lab MDD × 100), a moisture variation (how far field moisture sits from OMC, wet or dry) and a moisture ratio (field moisture ÷ OMC × 100). That needs oven moisture contents, which usually means waiting until the next day.
The Hilf rapid method (AS 1289.5.7.1) avoids the wait. Soil from the test hole is compacted at its field moisture and with measured amounts of water added or removed (z, as a fraction of the wet mass). Each wet density is divided by (1 + z) to give a “converted wet density”, and the peak is found. Because every specimen starts from the same field-moist soil, the ratio of field wet density to peak converted wet density equals the dry density ratio, with no moisture content needed. The standard limits added moisture to −4% to +6%. Clean sands with no clear compaction peak are controlled by density index (AS 1289.5.6.1) instead.
| Method | Speed | Strengths | Watch out for |
|---|---|---|---|
| Sand replacement | Slow, moisture next day | Direct volume, no licence | Vibration, unstable holes, sand calibration |
| Nuclear gauge | Minutes per test | Many tests per day | Moisture bias, licensing, probe depth |
| Hilf rapid method | Same day | No oven moisture needed | Added water limits, compaction gear near site |
Worked example: soil compaction test from field readings to pass or fail
A sand replacement test on a silty clay fill layer gives the readings below. The lab reference is the standard curve above: MDD 1.84 t/m³, OMC 14.5%.
| Reading | Value |
|---|---|
| Jar and sand, before and after | 9.850 kg and 4.150 kg |
| Sand held by cone and base plate (calibration) | 1.600 kg |
| Bulk density of calibrated sand | 1450 kg/m³ |
| Wet soil dug from the hole | 5.720 kg |
| Moisture tin: empty, wet soil, oven-dry | 52.4 g, 612.8 g, 546.9 g |
- Sand used: 9.850 − 4.150 = 5.700 kg
- Sand in the hole: 5.700 − 1.600 = 4.100 kg
- Hole volume: 4.100 ÷ 1450 = 0.002828 m³ (2828 cm³, roughly a 150 mm diameter hole 160 mm deep)
- Wet density: 5.720 ÷ 0.002828 = 2023 kg/m³ = 2.023 t/m³
- Moisture content: water 612.8 − 546.9 = 65.9 g; dry soil 546.9 − 52.4 = 494.5 g; w = 65.9 ÷ 494.5 = 0.1333 = 13.3%
- Dry density: 2.023 ÷ (1 + 0.1333) = 2.023 ÷ 1.1333 = 1.785 t/m³
- Dry density ratio: 1.785 ÷ 1.84 × 100 = 97.0% of standard MDD
- Moisture: 13.3% against OMC 14.5%, so 1.2% dry of optimum (moisture ratio 92%)
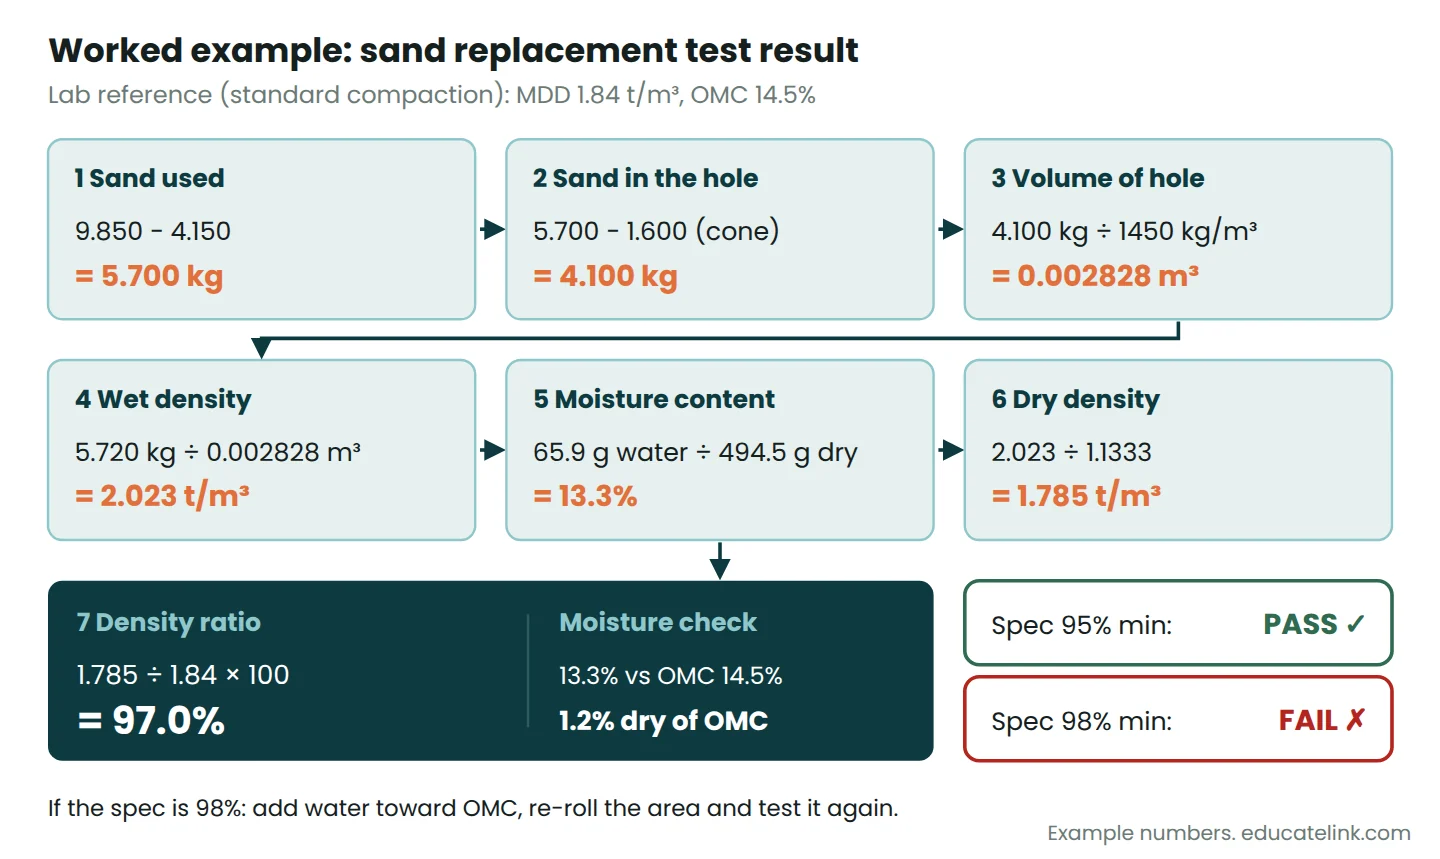
Against a 95% standard requirement for lot fill, this test passes. Against 98% for commercial fill, it fails. The moisture result tells you why: the layer is dry of optimum, so extra passes will struggle to add density. Add water toward OMC, mix it through the full depth and re-roll.
Typical compaction targets
These typical minimums from two published sources help you read a specification. Your project specification and geotechnical engineer set the real numbers, including whether the reference is standard or modified MDD.
| Use | Typical minimum dry density ratio | Reference | Example source |
|---|---|---|---|
| Residential lot fill | 95% | Standard | Ipswich City Council earthworks standard (based on AS 3798) |
| Commercial fill supporting minor loads | 98% | Standard | Same |
| Road embankment more than 0.3 m below subgrade | 95% | Standard | Same |
| Top 0.3 m below pavement subgrade | 100% | Standard | Same |
| Embankment construction (non-sand) | 90% (characteristic) | Modified | Main Roads WA Specification 302 |
| Subgrade preparation (non-sand) | 92% (characteristic) | Modified | Main Roads WA Specification 302 |
The lower WA percentages are not a weaker standard. They are percentages of a much higher modified MDD. Sands are treated separately in both systems: Main Roads WA sets higher ratios for Perth sands, and AS 3798 style specifications use density index for cohesionless soils.
Test frequency and lot-based testing
Earthworks are tested in lots: one layer of one material, placed and compacted the same way, over a defined area. Guidance based on AS 3798 sets minimum frequencies, using whichever rule gives more tests:
| Type of earthworks | Minimum frequency |
|---|---|
| Large-scale operations | 1 per 500 m³, or 1 per layer per material per 2500 m² |
| Small-scale operations | 1 per 200 m³, or 1 per layer per 1000 m² |
| Concentrated operations | 1 per 100 m³, or 1 per layer per 500 m² |
| Fill behind structures | 1 per 2 layers per 50 m² |
| Trenches under pavements and structures | 1 per 2 layers per 40 linear metres |
Road authorities often judge a whole lot on a statistical value. Victoria’s Section 173 uses six tests per lot and a characteristic value of mean − 0.92 × standard deviation. Take six results of 99.1, 97.6, 101.3, 98.4, 96.9 and 100.2%. The mean is 98.9% and the standard deviation 1.64, so the characteristic value is 98.9 − 0.92 × 1.64 = 97.4%. Against a 98% requirement the lot fails even though the average passes, because the results are too scattered.
Choose test locations at random and record each one by chainage and offset or by coordinates from the same control used for setting out the building. Note the layer level and test depth too, so a failed spot can be found again after re-work.
Moisture conditioning on site
Get moisture right before rolling, not after a failed test. Main Roads WA Specification 302, for example, requires most materials to be within 90% to 110% of OMC during compaction and limits cohesive layers to 300 mm.
Too dry: add water with the water cart in several light passes and mix it through the full depth with a grader or disc. Clays need time to take up water, so condition them ahead of rolling. Too wet: rip or turn the material and let sun and wind dry it, or spread it thinner. Lime treatment of wet clay is a design decision for the engineer, not a site fix. Rough check: squeeze a handful of clayey fill. Near OMC it holds together without leaving free water on your hand.
Next to retaining walls, use light plate or trench compactors. Heavy rollers close to a wall add lateral pressure the design may not allow for, and the retaining wall calculator shows how fast earth pressure grows with wall height.
Common mistakes
- Wrong lab reference. The borrow source changes but the MDD on the report does not. New material needs a new compaction test.
- Mixing standard and modified. 95% standard and 95% modified are different targets.
- Probe deeper than the layer. A nuclear reading that reaches the layer below measures the wrong material.
- No moisture correction. Uncorrected gauge moisture on a new soil can shift dry density enough to flip a pass to a fail.
- Vibration near a sand cone. Plant passing during the test settles the sand, so the hole volume reads high and the density low.
- Layers too thick. The top passes, the bottom stays loose, and a shallow test hides it.
- Ignoring oversize rock. AS 1289.5.4.1 covers material with no more than 20% retained on the 37.5 mm sieve. Rocky fill is usually accepted on a set compaction procedure and test rolling instead.
- Testing where it is easy. Edges, corners and areas around pits get less rolling, and that is where settlement shows up later.
Before ordering fill for the next stage, run the volumes through the earthwork calculator with a realistic fill factor, and check layer levels with the rise and fall method so each layer stays within the specified thickness.
Frequently asked questions
What is a passing result for a soil compaction test?
A pass is whatever the project specification sets. Common values are 95% of standard MDD for residential lot fill, 98% for commercial fill and 100% within the top 0.3 m below a pavement subgrade, usually with a moisture window around OMC.
What is the difference between standard and modified Proctor?
Modified Proctor uses about 4.5 times the compactive energy of standard Proctor, which gives a higher MDD and a lower OMC for the same soil.
Can the density ratio be more than 100%?
Yes. Heavy rollers can put in more energy than the standard lab test. If many results are well above 100%, check that the lab reference matches the material placed.
Which field density test should I use?
Use a nuclear gauge for routine testing when a licensed operator is available, and sand replacement where there is no gauge or a gauge result needs checking. The Hilf rapid method suits jobs that need density ratios on the same day.
References
- Standards Australia. AS 1289 Methods of testing soils for engineering purposes: 5.1.1 and 5.2.1 (dry density/moisture content relation, standard and modified compactive effort), 5.3.1 (sand replacement method using a sand-cone pouring apparatus), 5.4.1 (dry density ratio, moisture variation and moisture ratio), 5.7.1 (Hilf density ratio and Hilf moisture variation, rapid method) and 5.8.1 (nuclear surface moisture-density gauge, direct transmission mode).
- Standards Australia. AS 3798 Guidelines on earthworks for commercial and residential developments.
- ASTM International. ASTM D698, ASTM D1557, ASTM D1556/D1556M and ASTM D6938.
- Holtz, R. D., Kovacs, W. D., & Sheahan, T. C. (2011). An introduction to geotechnical engineering (2nd ed.). Pearson.
- Main Roads Western Australia. Specification 302 Earthworks.
- Department of Transport and Planning, Victoria. Section 173 Examination and testing of materials and work (roadworks).
- Ipswich City Council. Part 5 Standards for provision of earthworks, Tables 5.1.1 and 5.1.2.
- ARPANSA. Code of Practice and Safety Guide for Portable Density/Moisture Gauges Containing Radioactive Sources (2004).
This article is general information for learning and planning. Always follow your project specification, the current standard and the advice of the responsible engineer.


.jpg)
Leave a Reply