
Abiotic factors are the non-living physical and chemical conditions in an environment that affect living things: light, temperature, water, soil, pH, salinity, oxygen, wind, nutrients, fire and the shape of the land. Biotic factors are the living parts, such as predators, prey, competitors, parasites and decomposers. Together they decide which organisms can live in a place and how many of them it can support.
The quickest test is to ask whether a living organism is involved. Sunlight, rainfall and soil pH are abiotic. A fungus, a grazing kangaroo and competition between weeds are biotic. The word comes from the Greek a- (not) and bios (life).
Definition in plain language
- Abiotic factor: a non-living part of an environment that affects the organisms living there.
- Biotic factor: a living organism, or the activity of one, that affects other organisms.
- Ecosystem: a community of organisms together with the abiotic environment they interact with.
The main abiotic factors and how they affect organisms
Energy and climate: light, temperature and wind
- Light: plants need it for photosynthesis, so light intensity limits how fast producers grow, and day length triggers flowering and breeding in many species. Under a closed tropical rainforest canopy, often only 0.5 to 5% of the sunlight reaching the treetops gets to the forest floor. In the ocean there is rarely any significant light below 200 m, so photosynthesis stops there.
- Temperature: controls the rate of enzyme reactions, so it sets how fast organisms grow, move and reproduce. It matters especially for animals that take their heat from the environment (see our note on cold-blooded vs warm-blooded animals). It also sets the length of the growing season, which on the Arctic tundra is only 50 to 60 days.
- Wind: increases water loss from leaves, cools bodies, breaks branches and spreads pollen and seeds. Trees on exposed ridges and coasts are often stunted and bent away from the prevailing wind.
Water and chemistry: water, pH, salinity, oxygen and nutrients
- Water: every cell needs it. Arid lands receive less than 250 mm of rain a year, which is why desert plants store water in their stems, have deep or wide roots and lose leaves in dry spells.
- pH: affects enzymes and, in soil, which nutrients roots can absorb. Very acidic or very alkaline soils lock up some nutrients and release others in harmful amounts, so most plants grow best within a fairly narrow pH range.
- Salinity: seawater averages about 35 parts per thousand of dissolved salts. Freshwater organisms in salty water lose water from their cells by osmosis, so only salt-tolerant species live in estuaries and salt-affected farmland.
- Oxygen: easy to get in air but limited in water. Cold water holds more dissolved oxygen than warm water: fully saturated fresh water at sea level holds about 14.6 mg/L at 0 °C, 9.1 mg/L at 20 °C and about 7.5 mg/L at 30 °C. Water with less than 2 mg/L is called hypoxic. In waterlogged soils roots run short of oxygen, which is why mangroves grow breathing roots that poke above the mud.
- Nutrients: mineral ions such as nitrate, phosphate and potassium. Too little limits plant growth. Too much, from fertiliser run-off, causes algal blooms in rivers and lakes.
Ground and disturbance: soil, topography and fire
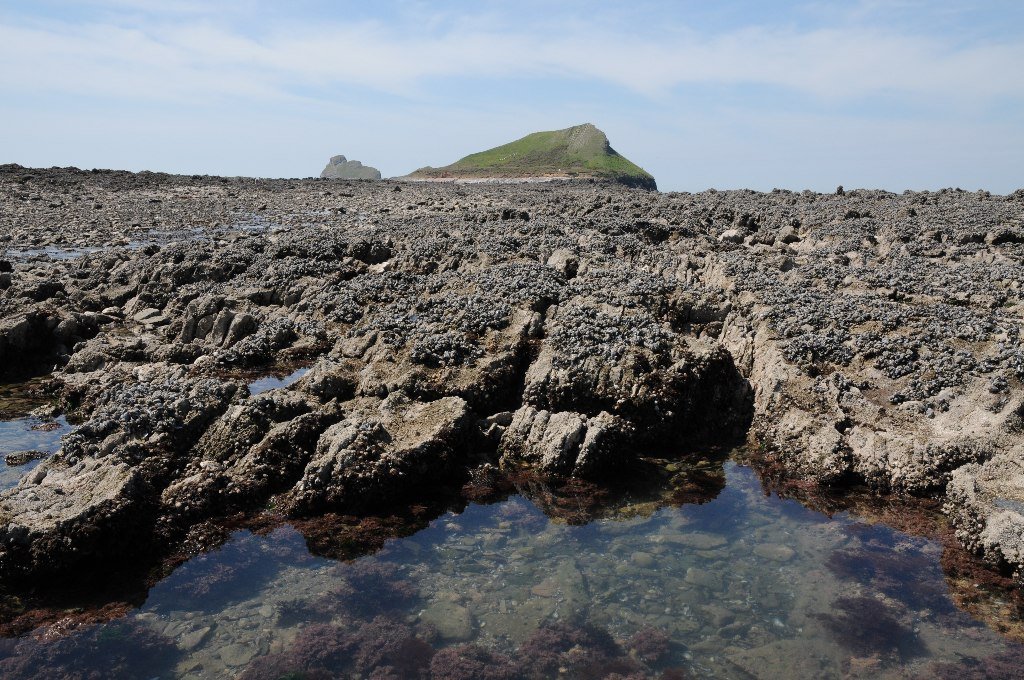
- Soil and substrate: sandy soils drain fast and hold few nutrients; clay soils hold water and nutrients but can become waterlogged. On a rocky shore the substrate decides who can attach: barnacles and limpets need bare rock, burrowing worms need sand or mud.
- Topography: slope, aspect and altitude. In the Southern Hemisphere, north-facing slopes get more sun and are warmer and drier than south-facing ones. Air temperature falls by about 6.5 °C for every 1,000 m of altitude on average, so mountains carry bands of different vegetation.
- Fire: removes plant cover and releases nutrients. Many Australian plants are built for it: eucalypts resprout from dormant buds under their bark, banksias and hakeas release seed from woody fruits opened by the heat, and heat or smoke breaks the dormancy of seeds stored in the soil, such as those of wattles.
Abiotic factors in different ecosystems
| Ecosystem | Key abiotic factors | Typical conditions | Example adaptations |
|---|---|---|---|
| Tropical rainforest | Light, rainfall, temperature, soil nutrients | Warm and wet all year; only a few per cent of sunlight reaches the floor; many soils are low in nutrients | Large thin leaves in the understorey; climbers and epiphytes reach up for light |
| Hot desert | Water, temperature range, light | Less than 250 mm of rain a year; large day to night temperature swings | Water-storing stems, deep roots, animals active at night |
| Ocean | Light, salinity, temperature, pressure | About 35 parts per thousand salt; little useful light below 200 m | Producers confined to the sunlit layer; deep-sea animals cope with darkness and high pressure |
| River or lake | Dissolved oxygen, flow rate, temperature, turbidity | Oxygen falls in warm, still or polluted water | Streamlined or clinging bodies in fast streams; gills with large surface areas |
| Arctic or alpine tundra | Temperature, wind, growing season, frozen ground | Arctic summers of 50 to 60 growing days; permafrost below the surface | Low cushion-shaped plants out of the wind; thick fur and fat in animals |
| Rocky shore | Tides, wave action, temperature, salinity | Rock pools heat up and get saltier at low tide, or fresher after rain | Shells that clamp shut; strong attachment to rock |
Biotic vs abiotic factors
| Feature | Abiotic factors | Biotic factors |
|---|---|---|
| Meaning | Non-living physical and chemical conditions | Living organisms and their activities |
| Examples | Light, temperature, water, pH, salinity, wind, fire | Predators, prey, competitors, parasites, pathogens, pollinators, decomposers |
| How you measure them | Instruments: light meter, thermometer, pH meter, anemometer | Counts and estimates: quadrats, transects, capture and recapture |
| What changes them | Weather, seasons, geology, human activity | Births, deaths, migration, disease, evolution |
| Typical effect | Sets which species can survive in a place | Changes how many survive through feeding, competition and disease |
How biotic and abiotic factors interact
The two are tangled together. Trees are biotic, but they change almost every abiotic factor beneath them: the canopy cuts light and wind and keeps the ground cooler and more humid, fallen leaves add organic matter to the soil, and deep roots draw water from far below. Earthworms mix and aerate soil. In the other direction, rainfall and temperature decide whether a region becomes rainforest, grassland or desert in the first place.
An organism’s features also depend on both its genes and its surroundings. Genetics experiments such as Mendel’s pea crosses rely on growing all the plants in similar conditions, so that differences between them come from inheritance rather than from light, water or soil.
Limiting factors: Liebig’s law and Shelford’s law
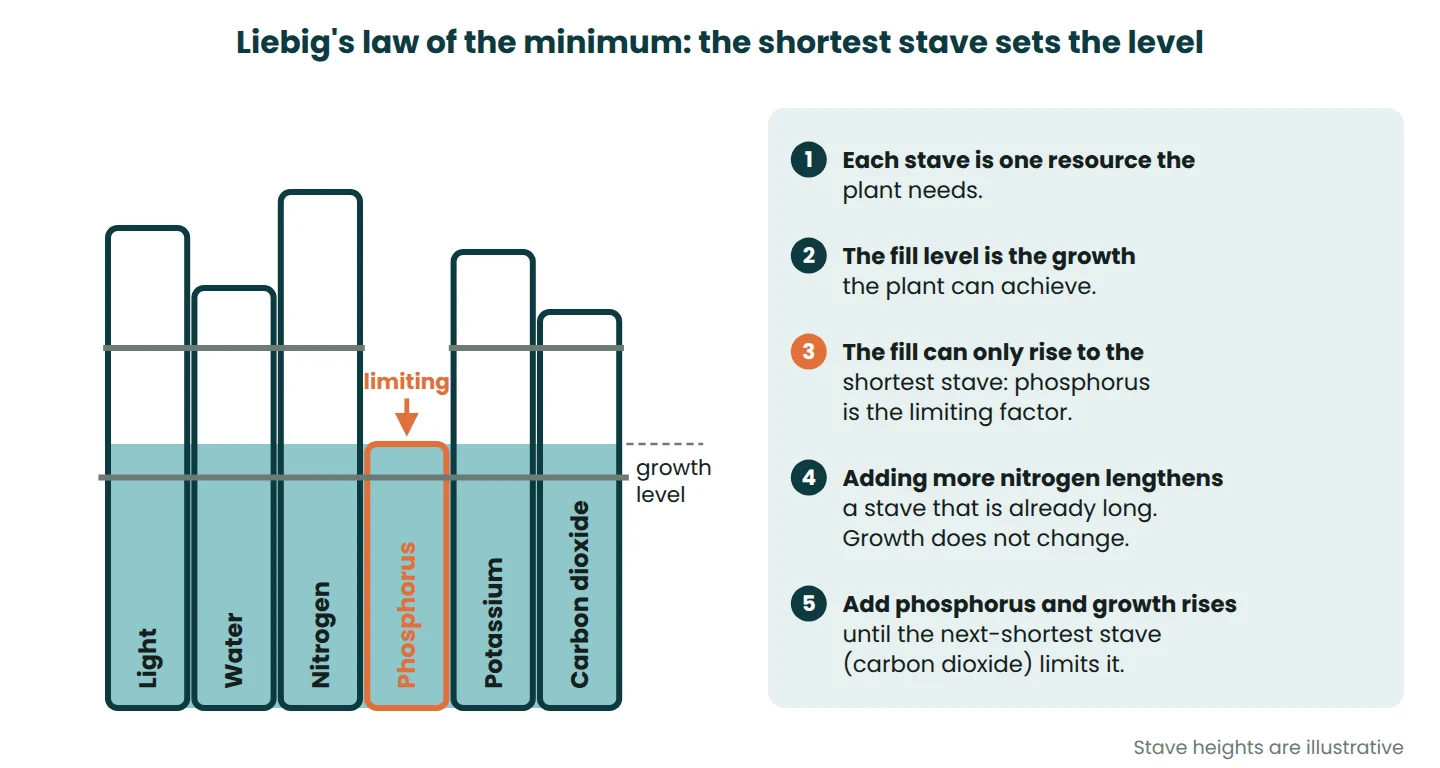
A limiting factor is the condition that holds back growth or population size at a particular time and place. Two classic ideas explain how it works.
Liebig’s law of the minimum
First set out by the agronomist Carl Sprengel and made famous by the chemist Justus von Liebig in the 1800s, this law says growth is controlled not by the total resources available but by the scarcest one relative to need. Adding more of a plentiful resource does nothing. Farmers see this when extra nitrogen fertiliser fails to lift the yield of a crop that is short of phosphorus.
Shelford’s law of tolerance
The ecologist Victor Shelford added the other side in the early twentieth century: too much of something can limit an organism as surely as too little. For each abiotic factor a species has a lower and an upper limit of tolerance, with an optimum range in between where it grows and breeds best. Near the limits individuals are stressed and rare. Beyond them the species is absent.
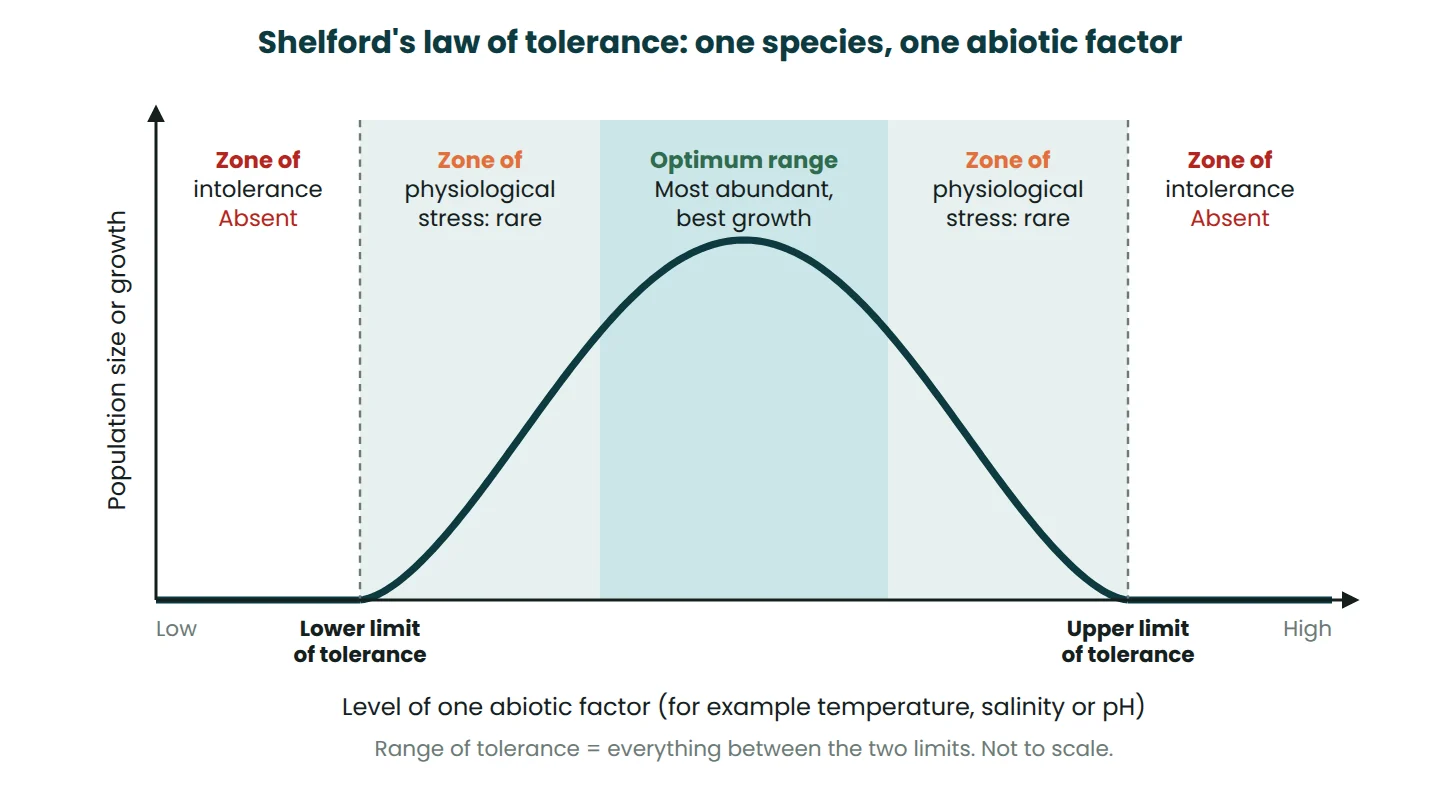
Species with a wide range are described with the prefix eury- (a euryhaline animal such as the brine shrimp copes with a wide range of salinity). Species with a narrow range get the prefix steno-. Reef-building corals are a well-known stenothermal example: when the water stays too warm for too long they lose the algae living in their tissues and bleach.
Worked example: measuring light and grass cover along a transect
A class runs a 45 m belt transect from inside a eucalypt woodland out into an open paddock. They place a 0.5 m × 0.5 m quadrat every 5 m, take three light meter readings at ground level in each quadrat and average them, then estimate the percentage of the quadrat covered by grass. The question is whether grass cover is linked to light intensity.
| Quadrat (distance) | Light (lux) | Grass cover (%) | Rank light | Rank cover | d | d² |
|---|---|---|---|---|---|---|
| Q1 (0 m) | 2,100 | 4 | 1 | 2 | −1 | 1 |
| Q2 (5 m) | 2,800 | 2 | 2 | 1 | 1 | 1 |
| Q3 (10 m) | 3,500 | 10 | 3 | 4 | −1 | 1 |
| Q4 (15 m) | 6,900 | 8 | 5 | 3 | 2 | 4 |
| Q5 (20 m) | 5,200 | 15 | 4 | 5 | −1 | 1 |
| Q6 (25 m) | 14,000 | 22 | 6 | 6 | 0 | 0 |
| Q7 (30 m) | 26,000 | 35 | 7 | 8 | −1 | 1 |
| Q8 (35 m) | 41,000 | 30 | 8 | 7 | 1 | 1 |
| Q9 (40 m) | 63,000 | 52 | 9 | 9 | 0 | 0 |
| Q10 (45 m) | 78,000 | 60 | 10 | 10 | 0 | 0 |
- Rank each column from lowest (1) to highest (10), then find the difference d for each quadrat and square it.
Σd² = 10. - Use Spearman’s rank correlation coefficient:
rₛ = 1 − 6Σd² ÷ (n(n² − 1)). - Substitute:
rₛ = 1 − (6 × 10) ÷ (10 × 99) = 1 − 60 ÷ 990 = 0.94. - Compare with the critical value for n = 10 at p = 0.05 (two-tailed), which is 0.648. Because 0.94 is larger, reject the null hypothesis: there is a significant positive correlation between light intensity and grass cover.
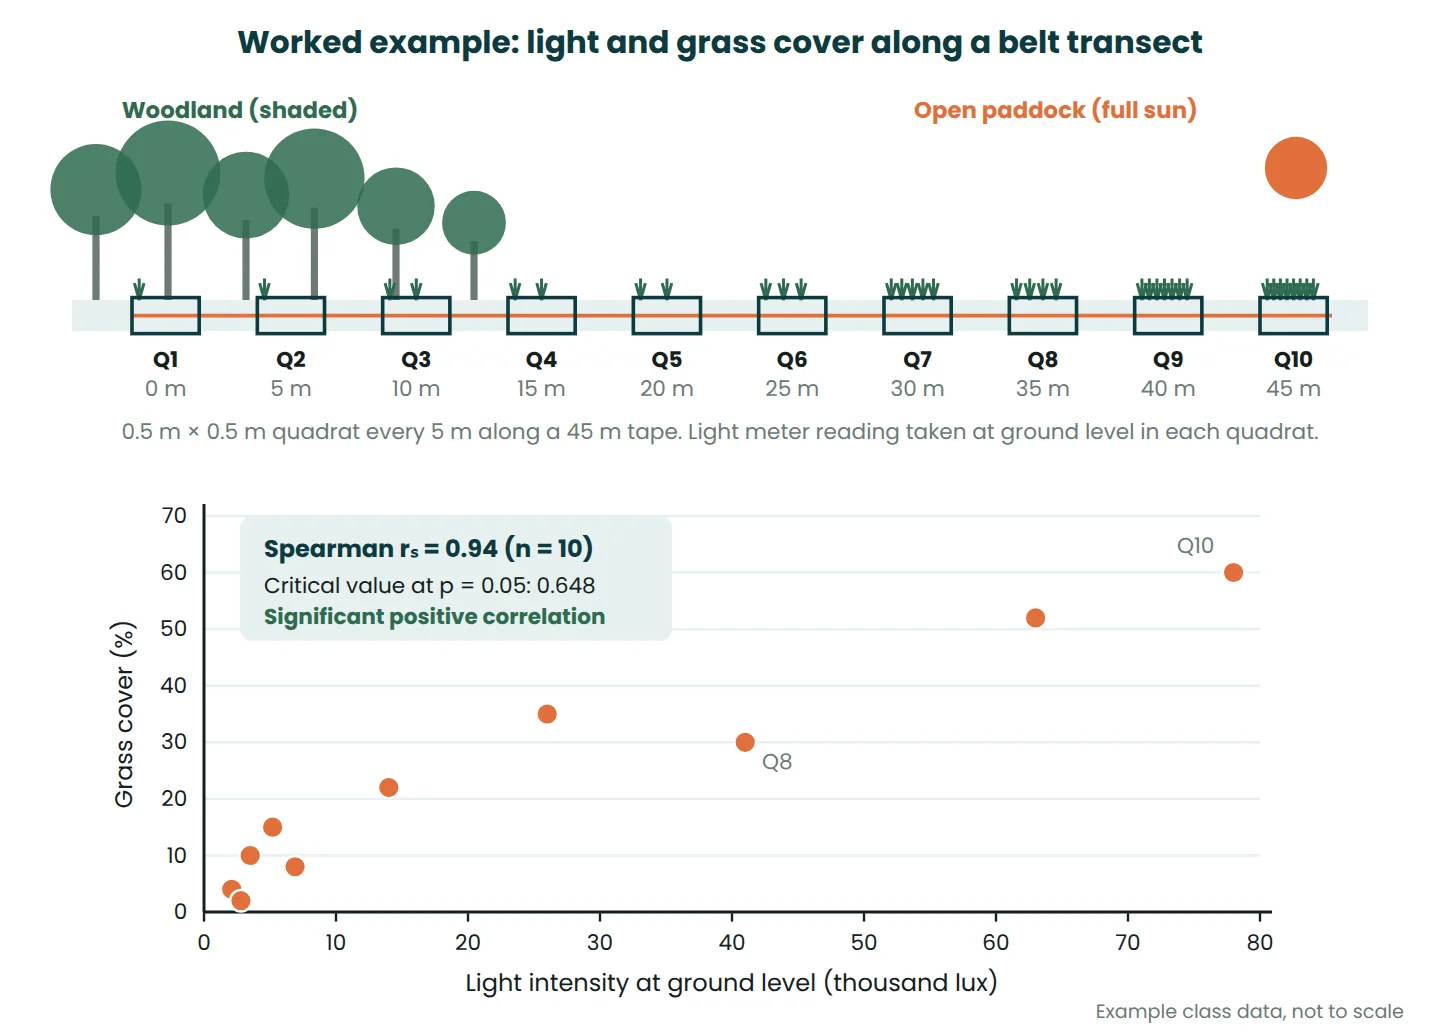
Now the judgement call. A correlation does not prove that light causes the change. Moving out of the woodland also changes soil moisture, root competition from the trees, leaf litter and grazing pressure. To test light on its own you would need an experiment, such as shading plots of grass in the open paddock and comparing them with unshaded plots.
Measuring abiotic factors in fieldwork
| Factor | Instrument or method | Units | Tip for reliable readings |
|---|---|---|---|
| Light intensity | Light meter | lux | Same height and angle each time; keep your shadow off the sensor |
| Air and soil temperature | Digital thermometer, soil probe or data logger | °C | Shade the air sensor; push soil probes to the same depth |
| Soil moisture | Moisture meter, or weigh, oven-dry at about 105 °C and reweigh | % | Dry until the mass stops changing |
| Soil or water pH | pH meter or indicator test kit | pH | Calibrate the meter with buffer solutions; use distilled water |
| Wind speed | Anemometer | m/s | Same height above ground; average over a set time |
| Dissolved oxygen | Oxygen meter or probe | mg/L | Record water temperature at the same time |
| Salinity | Conductivity meter or refractometer | ppt (or µS/cm for conductivity) | Rinse the probe with distilled water between sites |
| Turbidity | Secchi disc | m | Read on the shady side of the boat or jetty |
| Slope and aspect | Clinometer and compass | degrees | Take slope along the line of steepest fall |
For soil moisture, work out moisture % = (wet mass − dry mass) ÷ dry mass × 100. Some school courses divide by the wet mass instead, so state which you used. Then follow these steps on any field trip:
- Use a transect for change across a gradient, random quadrats to compare two areas.
- Measure all sites close together in time, because light and temperature change with cloud and sun angle.
- Take at least three readings at each point and use the mean.
- Record the date, time and weather so others can judge your results.
- Write it up with a method, results table and evaluation; our guide on how to write a lab report covers the structure.
Human influences on abiotic factors
- Climate change: global surface temperature was about 1.1 °C higher in 2011 to 2020 than in 1850 to 1900, according to the IPCC. That shifts temperature, rainfall and fire patterns, pushing some places beyond the tolerance limits of the species living there.
- Ocean acidification: the ocean absorbs about 30% of the carbon dioxide released into the atmosphere. NOAA reports that surface ocean pH has fallen by about 0.1 units since the industrial revolution, roughly a 30% increase in acidity, because the pH scale is logarithmic.
- Pollution: fertiliser and sewage add nutrients to waterways. Algae bloom and die, and the bacteria decomposing them use up dissolved oxygen until the water becomes hypoxic and fish die. Warm summer water makes this worse.
- Land clearing: removing trees raises light, temperature and wind at ground level and exposes soil to erosion. In parts of Australia, replacing deep-rooted native vegetation with shallow-rooted crops let water tables rise and carry dissolved salt to the surface. This is dryland salinity.
Common mistakes
- Writing “soil” or “weather” as the factor. Name the measurable part: soil pH, soil moisture, rainfall, wind speed.
- Calling soil purely abiotic. Its minerals, water and air are abiotic, but it is full of living organisms.
- Claiming cause from a correlation. A transect shows a link; only a controlled experiment shows cause.
- Thinking a limiting factor is always in short supply. Under Shelford’s law too much heat, salt or acidity limits growth as well.
- Measuring sites hours apart on a cloudy day, then comparing the light readings.
- Leaving out units or the number of repeats in a results table.
Practice questions
Question 1: sort the factors
Sort into abiotic and biotic: soil pH, a fungus infecting roots, wind speed, rabbits grazing, salinity, competition from weeds, day length.
Answer: Abiotic: soil pH, wind speed, salinity, day length. Biotic: the fungus, grazing rabbits and competition from weeds, because each involves a living organism.
Question 2: light reaching the floor
A light meter reads 80,000 lux in an open clearing and 1,600 lux on the forest floor nearby a few minutes later. What percentage of the light reaches the floor?
Answer: 1,600 ÷ 80,000 × 100 = 2%, typical of the floor under a closed canopy. Taking the readings within minutes of each other matters, or a passing cloud could change the answer.
Question 3: the fertiliser puzzle
A farmer adds extra nitrogen fertiliser, but the crop yield does not change. A soil test shows low phosphorus. Explain the result and predict what happens if phosphorus is added.
Answer: Phosphorus is the limiting factor, so by Liebig’s law adding nitrogen cannot raise growth. Adding phosphorus should raise the yield until another factor, such as water, light or potassium, becomes limiting.
Question 4: tolerance limits
A freshwater fish has tolerance limits of 4 °C and 30 °C, with an optimum of 15 to 22 °C. Predict its status at 18 °C, 27 °C and 33 °C. Why might a warm, still pond be worse than the temperature alone suggests?
Answer: 18 °C: optimum, so abundant. 27 °C: zone of stress, so rare. 33 °C: beyond the upper limit, so absent. Warm water also holds less oxygen, dropping from about 9.1 mg/L at saturation at 20 °C to about 7.5 mg/L at 30 °C, so heat stress and low oxygen act together.
Question 5: Spearman’s rank
Six quadrats have soil moisture of 12, 18, 25, 31, 40 and 46% and moss counts of 3, 7, 6, 10, 14 and 15. Calculate rₛ and decide whether the correlation is significant (critical value for n = 6 at p = 0.05 is 0.886).
Answer: Moisture ranks are 1 to 6. Moss ranks are 1, 3, 2, 4, 5, 6. Differences are 0, −1, 1, 0, 0, 0, so Σd² = 2. rₛ = 1 − (6 × 2) ÷ (6 × 35) = 1 − 12 ÷ 210 = 0.94. This is above 0.886, so there is a significant positive correlation between soil moisture and moss numbers.
Frequently asked questions
What are five examples of abiotic factors?
Light, temperature, water, soil pH and salinity are five common abiotic factors. Wind, dissolved oxygen, mineral nutrients, fire and altitude are also abiotic.
Is soil biotic or abiotic?
Soil is a mixture of both. Its mineral particles, water, air and pH are abiotic, while the bacteria, fungi, roots and earthworms living in it are biotic.
Is sunlight an abiotic factor?
Yes, sunlight is abiotic because it is non-living energy, and it is often the main factor limiting plant growth in forests and deep water.
What is the difference between abiotic and biotic factors?
Abiotic factors are non-living conditions such as temperature and pH, while biotic factors are living things and their effects, such as predation and competition. For related topics, browse our study notes.
References
- NOAA Ocean Service. How far does light travel in the ocean?
- NOAA Ocean Service. Why is the ocean salty?
- NOAA. Ocean acidification. Education resource collection.
- US Geological Survey. Deserts: geology and resources. What is a desert?
- US Geological Survey Water Science School. Dissolved oxygen and water.
- IPCC (2021) Summary for Policymakers. In: Climate Change 2021: The Physical Science Basis. Working Group I contribution to the Sixth Assessment Report.
- Auld, T.D. Fire and plants: how they recover. Australian Network for Plant Conservation.
- The University of Western Australia. Salinity (fact sheet).
This article is general information for learning and revision. Always check your course notes and your exam board’s requirements, including which statistical tables and formulas you are expected to use.


Leave a Reply