
Mendel’s experiment was a long series of crosses between garden pea plants, carried out by Gregor Mendel between 1856 and 1863. It showed that traits are passed on as separate units, now called genes, and do not blend. Cross a round-seeded pea with a wrinkled-seeded one and every seed in the next generation is round. Let those plants fertilise themselves and wrinkled seeds come back in about a quarter of the offspring.
In plain language: every pea plant carries two copies of each gene, one from each parent. When the plant makes pollen or egg cells, the two copies separate, so each sex cell gets only one. That is the law of segregation, and it is the main result of Mendel’s work.
Below are his real counts, Punnett squares, the test cross, a chi-square check and the mistakes that lose exam marks. More revision is on the EducateLink study notes page.
Who was Gregor Mendel?
Gregor Johann Mendel was born on 20 July 1822 in Heinzendorf in Austrian Silesia, now Hynčice in the Czech Republic. He entered the Augustinian abbey in Old Brno in 1843, studied at the University of Vienna from 1851 to 1853, and then ran his plant-breeding work in the abbey garden.
He presented his pea results to the Natural Science Society in Brno on 8 February and 8 March 1865 and published them in the society’s proceedings in 1866 as Versuche über Pflanzen-Hybriden (Experiments on Plant Hybrids). He became abbot in 1868, kept up research in meteorology and beekeeping, and died on 6 January 1884. His work went largely unrecognised in his lifetime.
Why garden peas suited Mendel’s experiment
Mendel chose the garden pea, Pisum sativum, on purpose. Each feature solved a practical problem.
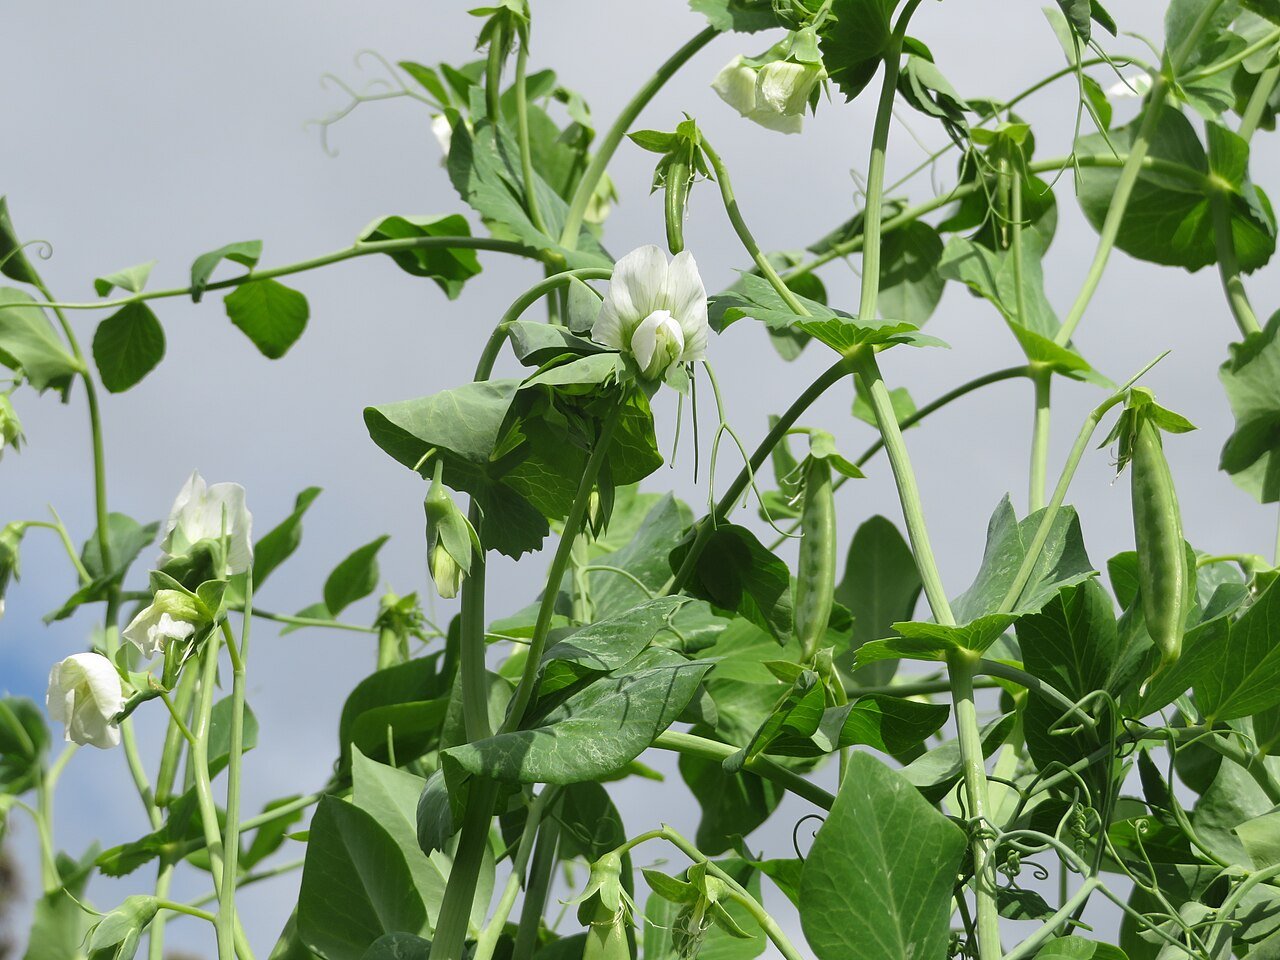
- It fertilises itself. The petals stay closed around the anthers and stigma until pollination is over. Generations of self-pollination give true-breeding lines whose offspring always match the parent.
- It is easy to cross by hand. Mendel opened young buds, removed the anthers before they shed pollen, and dusted the stigma with pollen from his chosen father plant.
- The traits are either-or. A seed is round or wrinkled, never in between, so counting is reliable.
- It is quick and productive. Peas complete a generation in one growing season and each plant sets plenty of seed, so large samples are cheap.
He also did the groundwork: 34 varieties from seed merchants were grown for two years to check they bred true, and 22 were kept for the main experiments.
The seven traits and Mendel’s F2 results
Mendel followed seven characters, each with two clear forms. He crossed true-breeding parents (the P generation), grew the hybrids (F1), let them self-pollinate and counted the F2 offspring. The counts below are from his 1866 paper. The ratio is dominant divided by recessive.
| Trait | Dominant form | Recessive form | F2 count | Ratio |
|---|---|---|---|---|
| Seed shape | Round | Wrinkled | 5,474 : 1,850 | 2.96 : 1 |
| Seed (cotyledon) colour | Yellow | Green | 6,022 : 2,001 | 3.01 : 1 |
| Flower colour | Violet-red, grey-brown seed coat | White, white seed coat | 705 : 224 | 3.15 : 1 |
| Pod shape | Inflated | Constricted | 882 : 299 | 2.95 : 1 |
| Unripe pod colour | Green | Yellow | 428 : 152 | 2.82 : 1 |
| Flower position | Axial (along the stem) | Terminal (at the top) | 651 : 207 | 3.14 : 1 |
| Stem length | Long | Short | 787 : 277 | 2.84 : 1 |
| All seven | 14,949 : 5,010 | 2.98 : 1 |
Two things stand out. The recessive form vanished in F1 and reappeared in F2, so it had been carried, hidden, all along. And no ratio is exactly 3 : 1, but all sit close to it. Pod colour, with only 580 plants, drifts furthest, while the seed traits, counted in thousands, land near 3. Small samples wander more, which is what chance predicts.
The monohybrid cross: P to F1 to F2
A monohybrid cross follows one gene. Write the dominant allele as a capital letter and the recessive as the same letter in lower case: R for round, r for wrinkled.
- P generation: a true-breeding round plant (
RR) is crossed with a true-breeding wrinkled plant (rr). The first makes onlyRgametes and the second onlyrgametes. - F1: every offspring is
Rr. OneRis enough to make the seed round, so all F1 seeds are round. - F2: each
Rrplant makesRandrgametes in equal numbers. Random fertilisation givesRR,Rr,Rrandrrwith equal chance.
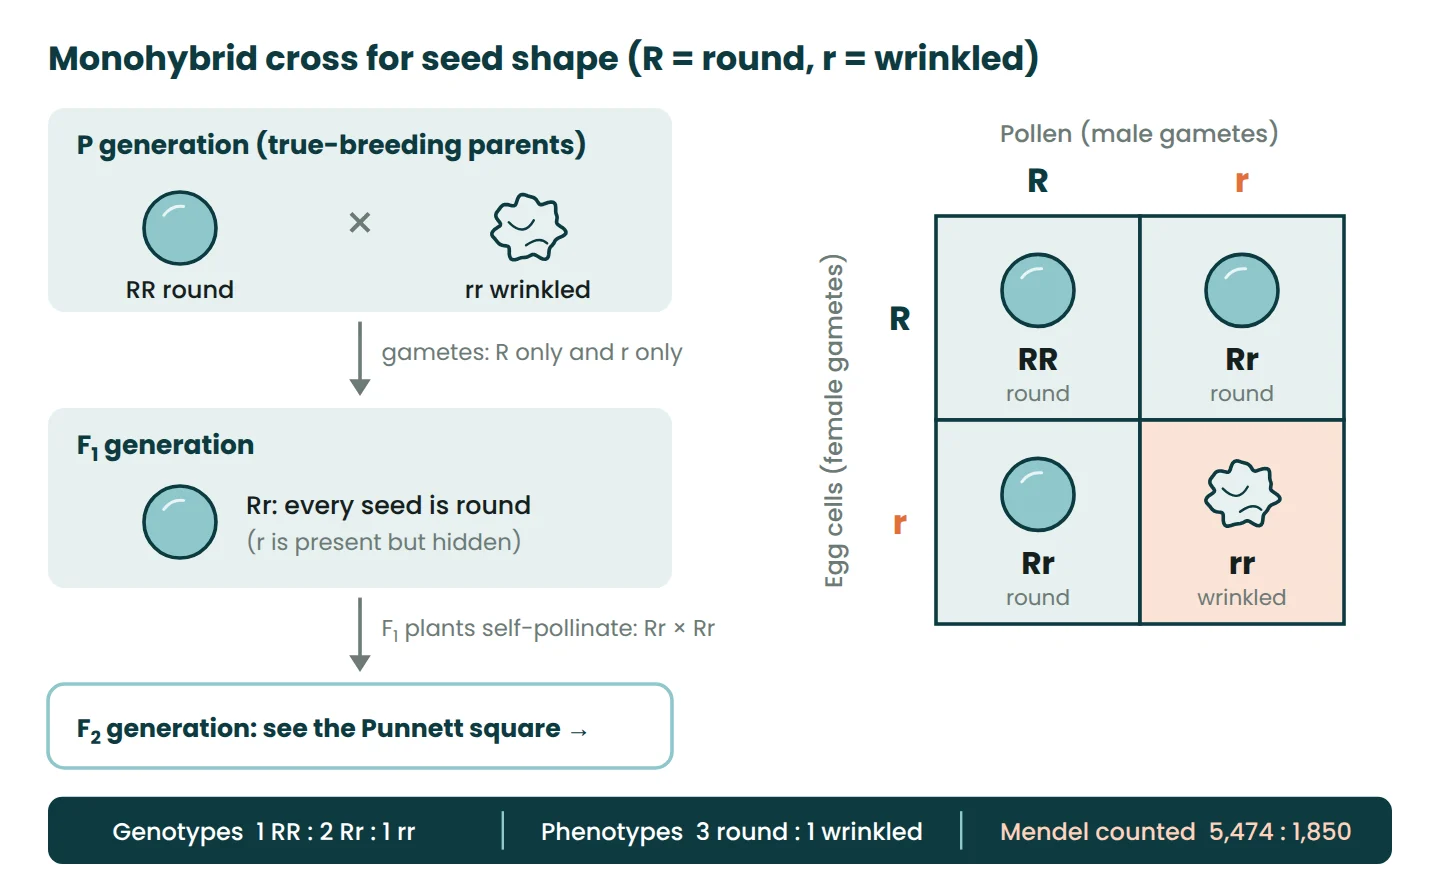
That gives a genotype ratio of 1 RR : 2 Rr : 1 rr and a phenotype ratio of 3 round : 1 wrinkled. Mendel checked the hidden 1 : 2 : 1 as well. He grew 565 plants from round F2 seeds: 193 produced only round seeds and 372 produced both kinds, a ratio of 1.93 : 1, close to the expected 2 : 1. For yellow seeds the figures were 166 and 353 (2.13 : 1).
The law of segregation in modern terms
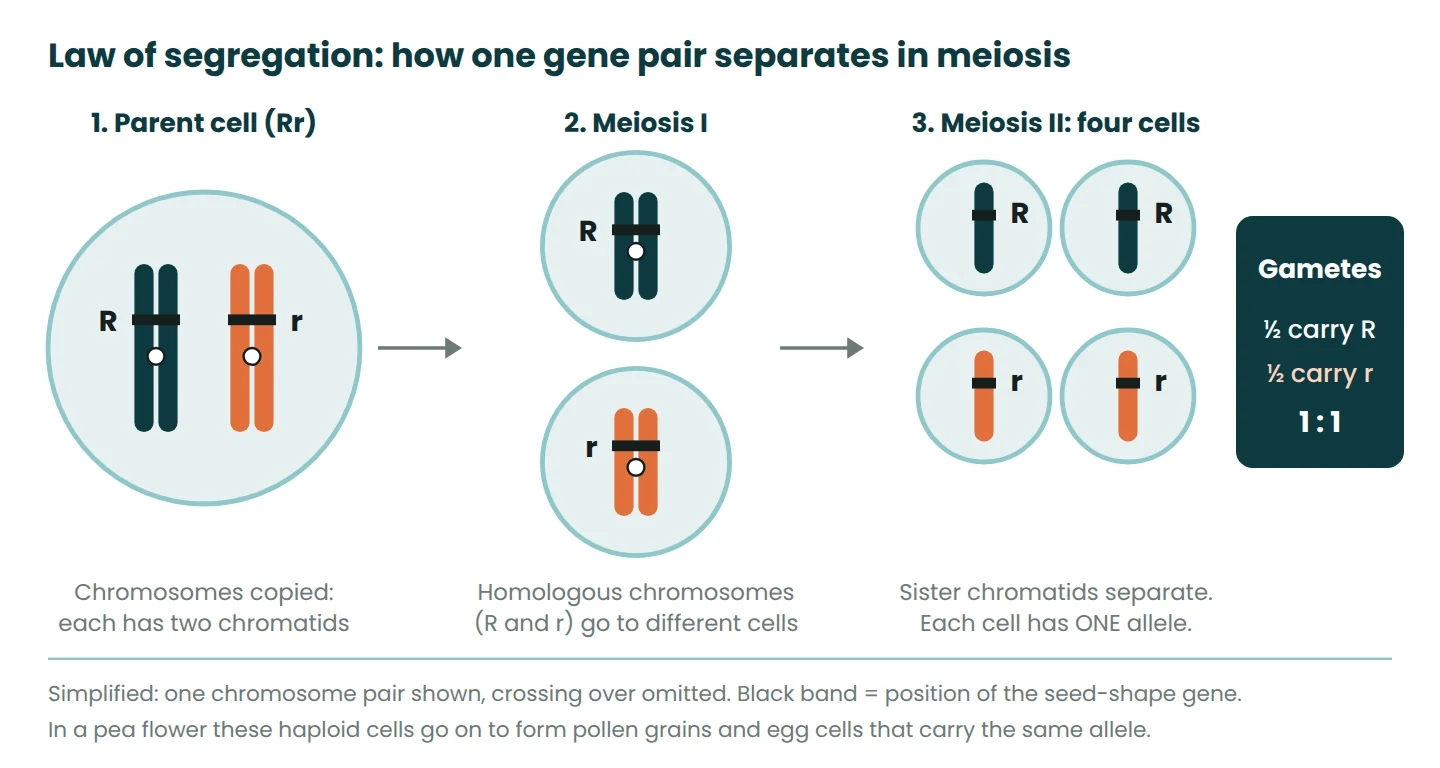
Mendel never saw a chromosome. He reasoned from his counts that each plant must hold a pair of hereditary units and pass on only one of them. Modern biology gives the same idea a physical basis:
- A gene is a section of DNA at a fixed place (locus) on a chromosome. Alleles are different versions of that gene, such as
Randr. - Pea body cells are diploid: they hold two copies of each chromosome, one from each parent. So each cell carries two alleles of every gene. Same alleles (
RR,rr) is homozygous. Different alleles (Rr) is heterozygous. - In meiosis I the homologous chromosomes separate into different cells, taking
Rwith one andrwith the other. Meiosis II then separates the sister chromatids. - Each gamete therefore carries one allele of each gene. Fertilisation brings two gametes together and restores the pair.
Seeing chromosomes separate needs stained cells and a light microscope at high power; the parts of a microscope note covers the lenses involved.
The law of dominance
In a heterozygote, one allele (the dominant one) decides the phenotype and the other (the recessive one) has no visible effect. Mendel used these two words himself. For seed shape the reason is now known: the wrinkled allele carries an inserted stretch of DNA that knocks out starch branching enzyme 1. One working copy of the gene makes enough enzyme for a normal round seed, so Rr looks the same as RR.
Dominance is not a universal rule. In snapdragons a red-flowered plant crossed with a white one gives pink offspring. That is incomplete dominance, and the F2 ratio becomes 1 red : 2 pink : 1 white because every genotype now has its own phenotype.
Dihybrid cross and independent assortment
Mendel then followed two genes at once. He crossed a round yellow plant (RRYY) with a wrinkled green one (rryy). The F1 seeds were all round and yellow (RrYy). Fifteen F1 plants then produced 556 seeds: 315 round yellow, 108 round green, 101 wrinkled yellow and 32 wrinkled green.
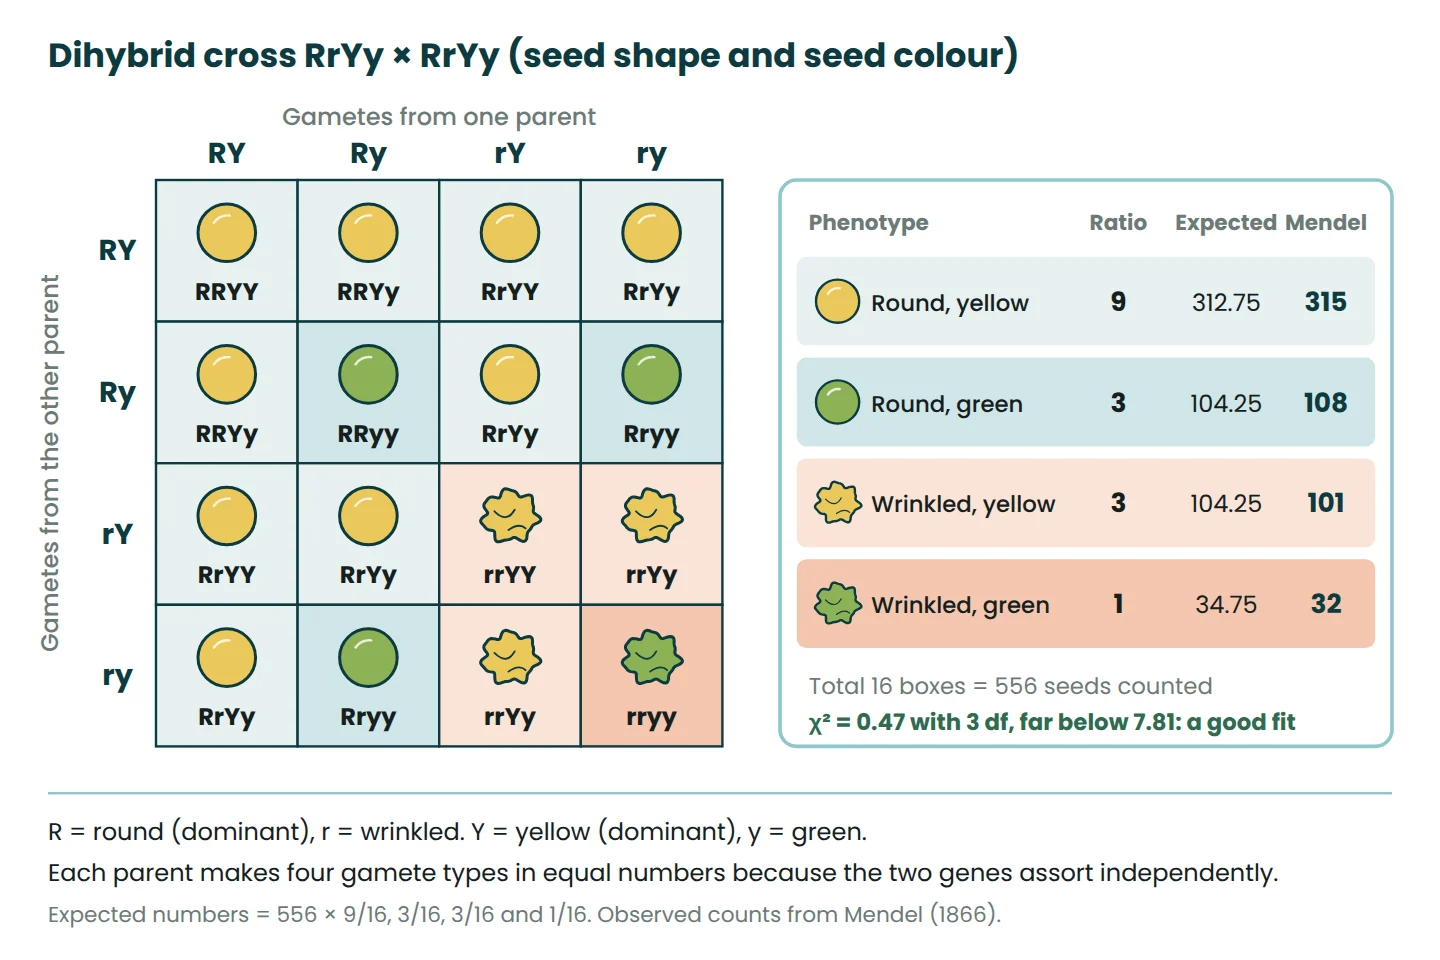
The pattern is 9 : 3 : 3 : 1. It appears because each RrYy plant makes four kinds of gamete (RY, Ry, rY, ry) in equal numbers, giving 16 equally likely combinations. A quicker way is to multiply the single-gene ratios: (3 round : 1 wrinkled) × (3 yellow : 1 green). For example, the chance of a round green seed is ¾ × ¼ = 3/16.
This is the law of independent assortment: the alleles of one gene sort into gametes independently of the alleles of another gene. The reason is that each homologous pair lines up at random at metaphase I, independently of the other pairs.
The exception: linked genes
Independent assortment holds only for genes on different chromosomes or far apart on one. Genes close together tend to travel together. William Bateson and Reginald Punnett met this in sweet peas in the early 1900s: purple, long-pollen × red, round-pollen gave an F2 of 284 : 21 : 21 : 55, where 9 : 3 : 3 : 1 predicts about 214 : 71 : 71 : 24. The parental combinations were far too common (χ² ≈ 135 against a critical value of 7.81). Thomas Hunt Morgan’s fruit-fly work later showed that crossing over in meiosis is what occasionally separates linked alleles.
Several of Mendel’s seven genes do share a chromosome, but his reported two-trait crosses never combined a closely linked pair.
The test cross
A round seed could be RR or Rr. You cannot tell by looking. A test cross settles it: cross the plant with a homozygous recessive (rr) and look at the offspring.
- All offspring round: the parent is almost certainly
RR. - About half round and half wrinkled: the parent is
Rr.
Mendel ran the two-gene version. He pollinated RrYy hybrids with pollen from a wrinkled green (rryy) plant and got 31 round yellow, 26 round green, 27 wrinkled yellow and 26 wrinkled green seeds. That is close to 1 : 1 : 1 : 1, which is direct evidence that the hybrid makes its four gamete types in equal numbers.
A small all-dominant result is weak evidence. A heterozygote gives 3 dominant offspring in a row 12.5% of the time, but 10 in a row only (½)¹⁰ ≈ 0.1% of the time, so count plenty before calling a line pure.
Worked example: chi-square test on Mendel’s experiment
The chi-square (χ²) test asks whether the gap between observed and expected counts could be chance. Take Mendel’s stem length result: 787 long and 277 short, 1,064 plants.
- Hypothesis: the F2 follows a 3 : 1 ratio.
- Expected counts: long
1,064 × ¾ = 798; short1,064 × ¼ = 266. - Calculate
χ² = Σ (O − E)² ÷ Efor each class (table below). - Degrees of freedom = number of classes − 1 = 2 − 1 = 1. The critical value at the 5% level (p = 0.05) is 3.84.
- Compare: 0.607 is well below 3.84, so the data are consistent with 3 : 1. The p-value is about 0.44: a deviation at least this large would turn up by chance in roughly 44% of repeat experiments.
| Class | Observed (O) | Expected (E) | O − E | (O − E)² ÷ E |
|---|---|---|---|---|
| Long | 787 | 798 | −11 | 121 ÷ 798 = 0.152 |
| Short | 277 | 266 | +11 | 121 ÷ 266 = 0.455 |
| Total | 1,064 | 1,064 | 0 | χ² = 0.607 |
Note the wording. A small χ² means you do not reject the 3 : 1 model. It does not prove it. If you run a similar test in a school practical with maize cobs or fruit flies, the lab report guide shows how to present the method, table and conclusion.
Why Mendel’s work was ignored until 1900
The paper was not hidden: the proceedings went to well over a hundred other societies and Mendel sent out reprints. It was still overlooked for 34 years:
- The maths. Explaining thousands of counted offspring with ratios and probability was unfamiliar to botanists of the 1860s.
- No physical explanation yet. The behaviour of chromosomes in meiosis, which explains segregation, was only worked out in the decades after 1866.
- An unlucky follow-up. The botanist Carl Nägeli encouraged Mendel to repeat the work in hawkweed (Hieracium), which can set seed without fertilisation. The ratios did not appear.
- Competing attention. Darwin’s theory of evolution dominated biological debate at the time.
In 1900 three botanists working separately, Hugo de Vries, Carl Correns and Erich von Tschermak, reached similar results and found Mendel’s paper. Genetics as a science grew from that point.
Common mistakes
- Mixing up genotype and phenotype.
Rris a genotype (the alleles). Round is a phenotype (what you see). Phenotype also depends on conditions: a plant with long-stem alleles can still be stunted by drought, poor light or cold. These abiotic factors do not change the genotype. - Treating ratios as exact predictions. 3 : 1 is a probability. With only four offspring, the chance of exactly three round and one wrinkled is
4 × (¾)³ × ¼ ≈ 0.42, so it happens less than half the time. - Writing gametes with two alleles of one gene. A gamete from
RrYyisRY,Ry,rYorry, neverRrorRR. - Thinking dominant means common or better. Dominance only describes what a heterozygote looks like. A dominant allele can be rare.
- Using 9 : 3 : 3 : 1 everywhere. It only applies to a cross between two double heterozygotes with unlinked genes.
RrYy × rryygives 1 : 1 : 1 : 1. - Running chi-square on percentages. Use the actual counts; percentages give the wrong χ².
Practice questions
1. A heterozygous long-stemmed pea (Tt) is crossed with a short-stemmed pea (tt). What fraction of the offspring will be short?
Answer: the Tt parent gives T or t gametes equally; the tt parent gives only t. Offspring are Tt or tt with equal chance, so half are short (1 long : 1 short).
2. An F2 from round × wrinkled parents has 800 seeds. How many wrinkled seeds do you expect, and how many of the round seeds should be heterozygous?
Answer: wrinkled = 800 × ¼ = 200. That leaves 600 round seeds, split 1 RR : 2 Rr, so 400 heterozygous and 200 homozygous.
3. In RrYy × RrYy, what is the probability of a wrinkled yellow seed? What is the probability of a seed that would breed true for both traits?
Answer: wrinkled yellow = ¼ × ¾ = 3/16. Breeding true needs homozygous for both genes: RRYY, RRyy, rrYY or rryy, each 1/16, so 4/16 = ¼.
4. Test Mendel’s pod colour result (428 green : 152 yellow) against 3 : 1 with chi-square.
Answer: total 580, so E = 435 green and 145 yellow. χ² = (−7)² ÷ 435 + 7² ÷ 145 = 0.113 + 0.338 = 0.451. With 1 degree of freedom the critical value is 3.84, so the data fit 3 : 1.
5. A violet-flowered plant crossed with a white-flowered plant gives 23 violet and 21 white offspring. What is the violet parent’s genotype? (P = violet, p = white.)
Answer: white offspring must be pp, so the violet parent passed on a p allele. It is Pp. This is a test cross and 23 : 21 is close to 1 : 1.
Frequently asked questions
What did Mendel’s experiment prove?
It proved that traits are inherited as separate units that come in pairs, separate when sex cells form and pair up again at fertilisation, replacing the old idea of blending inheritance.
Why is it called the law of segregation?
Because the two alleles of a gene segregate, meaning they separate, into different gametes. Half the gametes from an Rr plant carry R and half carry r.
What is the difference between segregation and independent assortment?
Segregation is about the two alleles of one gene separating from each other. Independent assortment is about alleles of different genes being sorted into gametes without affecting each other, which is true only for unlinked genes.
Did Mendel fake his results?
There is no evidence he invented data. In 1936 the statistician R. A. Fisher argued that the counts fit the ratios more closely than chance would normally allow, and the reason is still debated. The ratios themselves have been reproduced countless times since.
References
- Mendel, G. (1866). Experiments in Plant Hybridization (English translation of Versuche über Pflanzen-Hybriden). MendelWeb.
- OpenStax. Biology 2e, 12.1 Mendel’s Experiments and the Laws of Probability. Rice University.
- OpenStax. Biology 2e, 12.2 Characteristics and Traits. Rice University.
- OpenStax. Biology 2e, 12.3 Laws of Inheritance. Rice University.
- Mendel Museum, Masaryk University. Gregor Johann Mendel.
- DNA Learning Center, Cold Spring Harbor Laboratory. Gregor Mendel (1822 to 1884).
- McClean, P. Linkage and Distorted Mendelian Ratios. North Dakota State University course notes.
These notes are general information for learning and revision. Check your course notes and your exam board’s requirements for the exact wording, symbols and methods you are expected to use.



.jpg)
Leave a Reply