
An earthwork volume calculation turns survey levels into cubic metres of cut and fill. Along a road, drain or trench, you work out the cut or fill area at each cross-section and multiply the average of each pair of areas by the distance between them. On a building pad you lay a grid over the site and average the depths at the grid points. Both give a bank volume, the soil as it sits in the ground, which you then convert to loose volume for trucks and compacted volume for fill.
The worked examples are a 160 m road, from cross-sections to a mass haul diagram, and a 40 m × 30 m pad, from grid levels to a balanced formation level.
You can run your own sections through the free earthwork calculator. It uses the same average end area sums and running net volume as the road example, and adds a prismoidal figure when the sections are equally spaced and odd in number.
Bank, loose and compacted volume
Soil changes volume every time it is handled, so a quantity means nothing until you say which state it is in.
- Bank volume (BCM, bank cubic metres): soil undisturbed in the ground. Cut quantities from survey are bank volumes.
- Loose volume (LCM): soil after digging, in a bucket, truck or stockpile. Breaking it up adds voids, so it swells.
- Compacted volume (CCM): soil placed in layers and rolled. Fill quantities from the design surface are compacted volumes.
Most soils swell when dug and end up smaller than their bank volume once compacted. Blasted rock never packs back down to its bank volume. So 1,000 m³ of cut rarely makes exactly 1,000 m³ of fill, and it won’t fit in 100 loads of a 10 m³ truck.
Cross-section areas from levels
For a road, channel or trench, take cross-sections at a regular interval along the centreline (20 m in the example), plus extra ones where the ground changes sharply and at grade points, where cut changes to fill. Each needs ground levels across the line, usually booked by the rise and fall method, and the design formation level, width and batters. Batters are written horizontal to vertical: a 1.5:1 batter is 66.7% or 33.7°, and the slope calculator converts between the forms.
Level section
When the ground is level across the line, the cut or fill is a trapezium. With formation width b, batter s horizontal to 1 vertical and centre depth h, A = h × (b + s × h), and the width between slope stakes is b + 2 × s × h. At chainage 40 of the example road (b = 10 m, s = 1.5, h = 2.70 m), A = 2.70 × 14.05 = 37.94 m² and the top width is 18.10 m.
Two-level section
When the ground falls steadily across the line at 1 in k, the high-side batter runs further before it meets the ground. With centre depth c, work out m = b/2 + s × c, then:
- side widths: uphill
wu = m × k ÷ (k − s), downhillwd = m × k ÷ (k + s) - side heights above formation:
hu = (wu − b/2) ÷ sandhd = (wd − b/2) ÷ s - area:
A = c × (wd + wu) ÷ 2 + b × (hd + hu) ÷ 4
With the ground falling 1 in 8 at chainage 40: m = 9.05 m, wu = 9.05 × 8 ÷ 6.5 = 11.14 m and wd = 9.05 × 8 ÷ 9.5 = 7.62 m, and the side heights are 4.09 m and 1.75 m. A = 2.70 × 18.76 ÷ 2 + 10 × 5.84 ÷ 4 = 39.93 m².
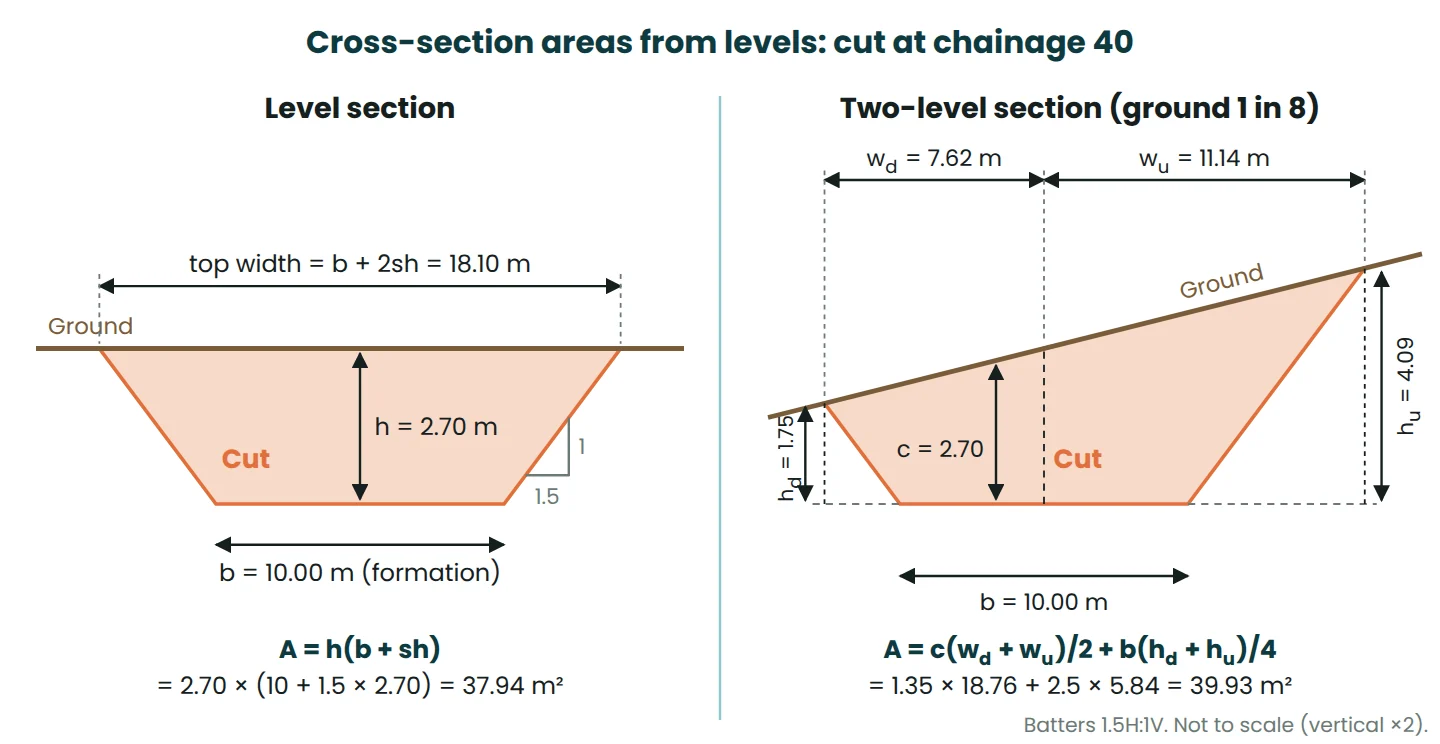
Same centre depth, 5.2% more area, so centreline depths alone underestimate cut on side-long ground. The area formula works for any three-level section. For irregular ground, list the corner points as offset and height pairs and use the coordinate (shoelace) method, the same calculation the land area calculator runs on plan coordinates.
Earthwork volume calculation by average end area: worked example
Average end area treats each length between two sections as a prism with the mean of its two end areas: V = L × (A₁ + A₂) ÷ 2. With equal spacing the total is V = L × (A₁/2 + A₂ + … + Aₙ₋₁ + Aₙ/2).
The example road has a 10 m formation falling at 1.0%, cut batters at 1.5:1 and fill batters at 2:1. It cuts through a low ridge, meets the ground at the grade point (chainage 80), then crosses a gully on fill. All sections are level sections to keep the arithmetic visible; real ones would also carry table drains, the pavement box and the topsoil strip.
| Chainage (m) | Ground RL (m) | Formation RL (m) | Centre depth (m) | Cut area (m²) | Fill area (m²) |
|---|---|---|---|---|---|
| 0 | 52.900 | 52.000 | 0.90 cut | 10.215 | 0 |
| 20 | 53.600 | 51.800 | 1.80 cut | 22.860 | 0 |
| 40 | 54.300 | 51.600 | 2.70 cut | 37.935 | 0 |
| 60 | 52.750 | 51.400 | 1.35 cut | 16.234 | 0 |
| 80 | 51.200 | 51.200 | 0 (grade point) | 0 | 0 |
| 100 | 49.900 | 51.000 | 1.10 fill | 0 | 13.420 |
| 120 | 48.600 | 50.800 | 2.20 fill | 0 | 31.680 |
| 140 | 48.950 | 50.600 | 1.65 fill | 0 | 21.945 |
| 160 | 49.300 | 50.400 | 1.10 fill | 0 | 13.420 |
Fill areas use s = 2.0, so at chainage 120, A = 2.20 × (10 + 2.0 × 2.20) = 31.68 m². Chainage 80 sits exactly on the grade point, so its area is zero. If a grade point falls between sections, add a section there: averaging a cut-only section with a fill-only section overstates both.
| Leg (chainage) | Cut, AEA (m³) | Fill, AEA (m³) | Prismoidal correction (m³) | Cut, prismoidal (m³) | Fill, prismoidal (m³) | Running net, bank (m³) |
|---|---|---|---|---|---|---|
| 0 to 20 | 330.8 | 0 | 4.05 | 326.7 | 0 | 330.8 |
| 20 to 40 | 608.0 | 0 | 4.05 | 603.9 | 0 | 938.7 |
| 40 to 60 | 541.7 | 0 | 9.11 | 532.6 | 0 | 1,480.4 |
| 60 to 80 | 162.3 | 0 | 9.11 | 153.2 | 0 | 1,642.7 |
| 80 to 100 | 0 | 134.2 | 8.07 | 0 | 126.1 | 1,493.8 |
| 100 to 120 | 0 | 451.0 | 8.07 | 0 | 442.9 | 993.2 |
| 120 to 140 | 0 | 536.3 | 2.02 | 0 | 534.2 | 397.9 |
| 140 to 160 | 0 | 353.7 | 2.02 | 0 | 351.6 | 5.4 |
| Total | 1,642.7 | 1,475.1 | 46.5 | 1,616.4 | 1,454.9 | +5.4 |
Totals and running net are from unrounded values. One leg in full: chainage 20 to 40 gives V = 20 × (22.860 + 37.935) ÷ 2 = 608.0 m³ of cut. The last column is cut minus 1.11 × fill, in bank cubic metres, where 1.11 converts compacted fill back to the bank volume needed to build it. The earthwork calculator gives the same running total with a fill factor of 1.11, and that total is the mass haul ordinate.
The prismoidal formula and the prismoidal correction
Average end area is exact only if the area changes linearly between sections. On a level section area grows with the square of depth, so the average of the end areas exceeds the true area halfway along and the method overestimates.
The prismoidal formula adds the mid-section: V = L × (A₁ + 4Aₘ + A₂) ÷ 6. Aₘ is built from the average dimensions of the two ends, not the average of their areas. For chainage 20 to 40 the mid depth is 2.25 m, so Aₘ = 2.25 × (10 + 1.5 × 2.25) = 30.09 m² and V = 20 × (22.86 + 4 × 30.09 + 37.94) ÷ 6 = 603.9 m³.
The prismoidal correction gets the same result without drawing mid-sections. For level and three-level sections, Cp = L × (c₁ − c₂) × (w₁ − w₂) ÷ 12, with c the centre depth and w the width between slope stakes. For chainage 20 to 40, Cp = 20 × 0.90 × (18.10 − 15.40) ÷ 12 = 4.05 m³, and 608.0 − 4.05 = 603.9 m³. Over the road the corrections total 26.3 m³ of cut and 20.2 m³ of fill, giving 1,616.4 m³ and 1,454.9 m³.
The earthwork calculator applies the prismoidal formula as Simpson’s rule, treating every second section as the mid-section of a 40 m prismoid: V = L ÷ 3 × (A₁ + 4A₂ + 2A₃ + 4A₄ + … + Aₙ). Here it returns the same 1,616.4 m³ and 1,454.9 m³, because the ground runs straight between alternate sections. Where the ground bends between sections the two forms differ, since Simpson’s rule fits a curve through each set of three.
When the difference matters
The correction here is about 1.5%, which rarely changes a decision on a small job. It matters on large jobs paid by the cubic metre, especially in rock. It also grows with the square of the change in depth between level sections (the largest here are either side of chainage 60) and in proportion to leg length.
Section spacing matters more than the formula. Leave out chainage 120, the bottom of the gully, and the fill from 100 to 140 drops from 987.3 m³ to 707.3 m³, 28% less. No formula recovers ground you never surveyed.
Grid method for a building pad
For a pad, car park or basement, the grid (spot height or borrow pit) method is quicker. Take a ground level at every point of a square grid and work out each depth as ground RL minus formation level, positive for cut. Each square’s volume is its area a times the average of its four corner depths: V = a × (h₁ + h₂ + h₃ + h₄) ÷ 4.
Add up the squares and each point is counted once for every square it touches. That gives the weights: 1 for an outside corner, 2 for an edge point, 3 for the inside corner of an L-shaped area and 4 for an interior point. So V = a ÷ 4 × Σ(weight × depth), and the weights must add up to four times the number of squares.
Worked example: 40 m × 30 m pad
The ground under this pad falls about 1.5 m from back to front. A 10 m grid gives 20 points and 12 squares of 100 m², and the weights add up to 48.
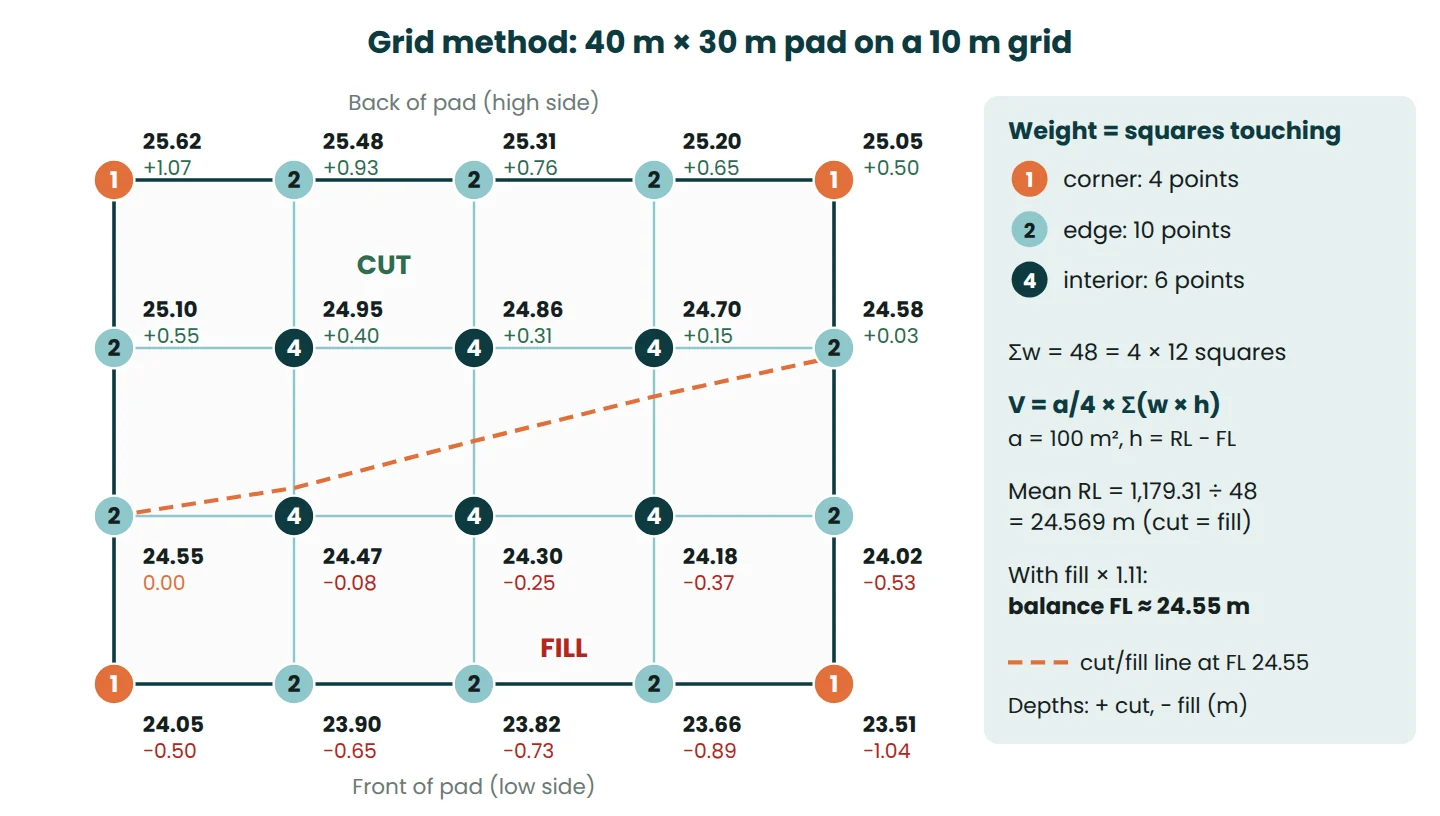
Because the weights don’t depend on the formation level, you can weight the ground RLs themselves. The weighted mean ground level is the formation level at which cut equals fill.
| Point type | Points | Sum of ground RLs (m) | Weight | Weighted sum (m) |
|---|---|---|---|---|
| Corner | 4 | 98.23 | 1 | 98.23 |
| Edge | 10 | 245.62 | 2 | 491.24 |
| Interior | 6 | 147.46 | 4 | 589.84 |
| Total | 20 | Σw = 48 | 1,179.31 |
Weighted mean = 1,179.31 ÷ 48 = 24.569 m. At any other level, the net volume is the pad area times the difference: at FL 24.40, net = 1,200 × (24.569 − 24.400) = 202.8 m³ of surplus cut.
For separate cut and fill, split the squares that have both cut and fill corners. A good hand approximation is Vcut = a ÷ 4 × (Σc)² ÷ (Σc + Σf) and Vfill = a ÷ 4 × (Σf)² ÷ (Σc + Σf), with Σc and Σf the sums of the cut and fill depths at the square’s corners, both taken as positive. On this pad it is within 1 m³ of an exact split. Batters beyond the pad edge are extra; take them off with sections along each side.
Balancing cut and fill: finding the formation level
A balanced pad uses its own cut as fill, with nothing imported or carted away. The weighted mean balances bank cut against compacted fill one for one, which real soil doesn’t do. A bank cubic metre of loam or clay compacts to about 0.90 m³, so each cubic metre of fill needs about 1.11 m³ of cut. The condition is cut = 1.11 × fill.
- At the weighted mean, FL 24.569, cut and fill are both 241.8 m³, but the fill needs 1.11 × 241.8 = 268.4 m³ of bank material: 26.6 m³ short.
- Lowering the pad by Δ adds 1,200 × Δ to the net volume, so Δ ≈ 26.6 ÷ 1,200 = 0.022 m. Try FL 24.547.
- Recalculate, round to a buildable level and check again.
| Formation level (m) | Cut, bank (m³) | Fill, compacted (m³) | Bank needed, 1.11 × fill (m³) | Cut minus bank needed (m³) |
|---|---|---|---|---|
| 24.569 (no factor) | 241.8 | 241.8 | 268.4 | −26.6 |
| 24.547 (first estimate) | 255.3 | 228.9 | 254.1 | +1.2 |
| 24.550 (adopted) | 253.4 | 230.7 | 256.1 | −2.7 |
FL 24.55 is 2.7 m³ short, less than half a truckload and well inside what a 10 m grid can resolve. So the pad balances at about 24.55 m, roughly 20 mm below the no-factor level. Sand or gravel (fill factor 1.05) moves it less. Blasted rock (0.77) moves it up, because rock takes up more room compacted than it did in the ground.
Topsoil changes the answer
Those were natural surface levels, and topsoil has to be stripped first. With an assumed 150 mm strip, 1,200 × 0.15 = 180 m³ goes to stockpile. Against the stripped surface, FL 24.55 gives 169.5 m³ of cut and 326.8 m³ of fill, which needs 362.7 m³ of bank material: 193 m³ short, or about 25 loads of imported fill at 10 m³ loose each. Since stripping lowers the whole surface equally, the balance level on stripped ground is simply 150 mm lower, about 24.40 m.
Swell and shrinkage: converting bank to loose and compacted volume
Factors from your own site are best: test pit densities, laboratory compaction results and truck counts checked against survey. For planning, published averages are a fair start. The table is from the US Army earthmoving manual, TM 3-34.62, Table 1-1, which describes them as averages for common materials that vary with grain size, moisture and degree of compaction.
| Material (typical averages) | Bank | Loose | Compacted | Fill factor, compacted to bank |
|---|---|---|---|---|
| Sand or gravel | 1.00 | 1.11 | 0.95 | 1.05 |
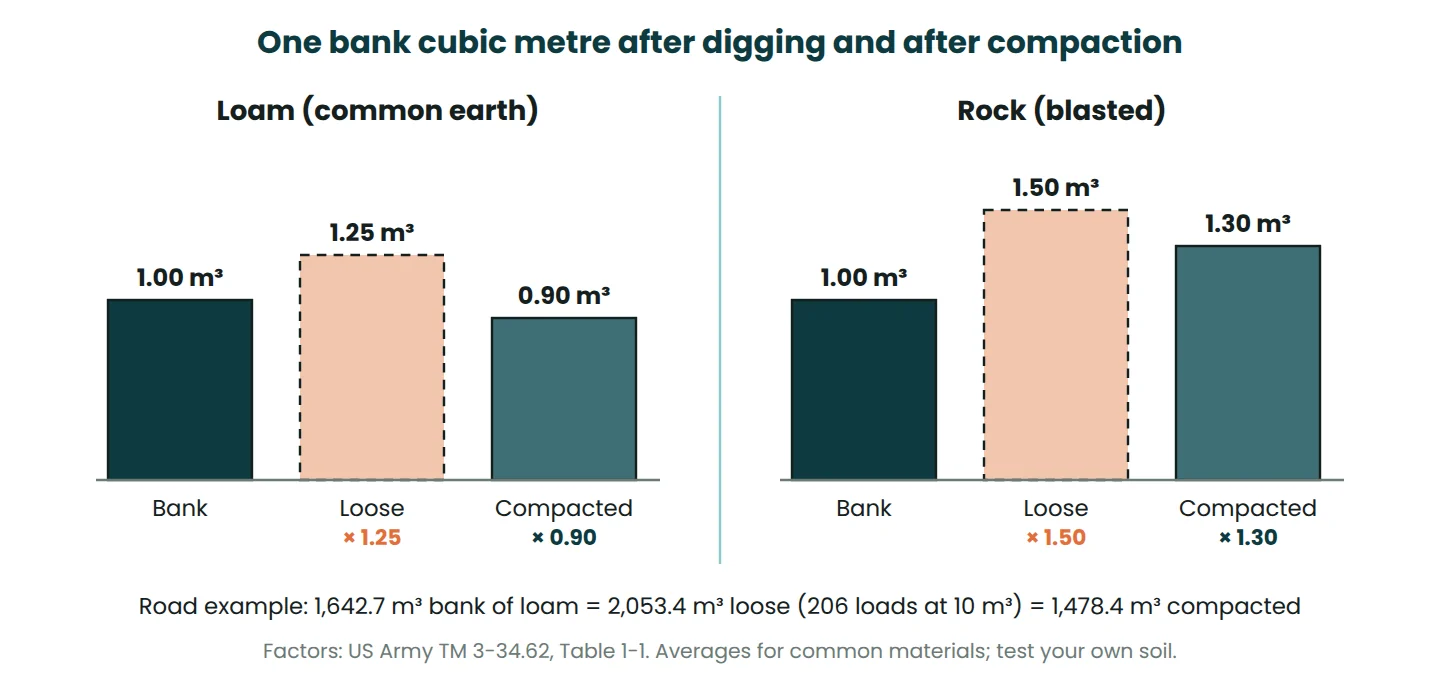
| Loam (common earth) | 1.00 | 1.25 | 0.90 | 1.11 |
| Clay | 1.00 | 1.43 | 0.90 | 1.11 |
| Rock (blasted) | 1.00 | 1.50 | 1.30 | 0.77 |
Swell is the increase from bank to loose (25% for loam). Shrinkage is the loss from bank to compacted (10% for loam). The compacted factor depends on the density actually achieved, so it shifts with the compaction specification; see soil compaction test methods.
Worked example: the road cut in loam
- Bank cut: 1,642.7 m³ (average end area).
- Loose: 1,642.7 × 1.25 = 2,053.4 m³. At 10 m³ loose per truck that is 205.3, so 206 loads.
- Compacted: 1,642.7 × 0.90 = 1,478.4 m³, against 1,475.1 m³ of fill. Done the calculator’s way, the fill needs 1,475.1 × 1.11 = 1,637.4 m³ of cut, about 5 m³ less than you have. The road balances.
Compare cut and fill directly without converting and you see a false 167.6 m³ surplus, about 21 truckloads. Cart it away and you will be buying fill back later. Had the cut been blasted rock, the same 1,642.7 m³ would take up about 2,136 m³ compacted.
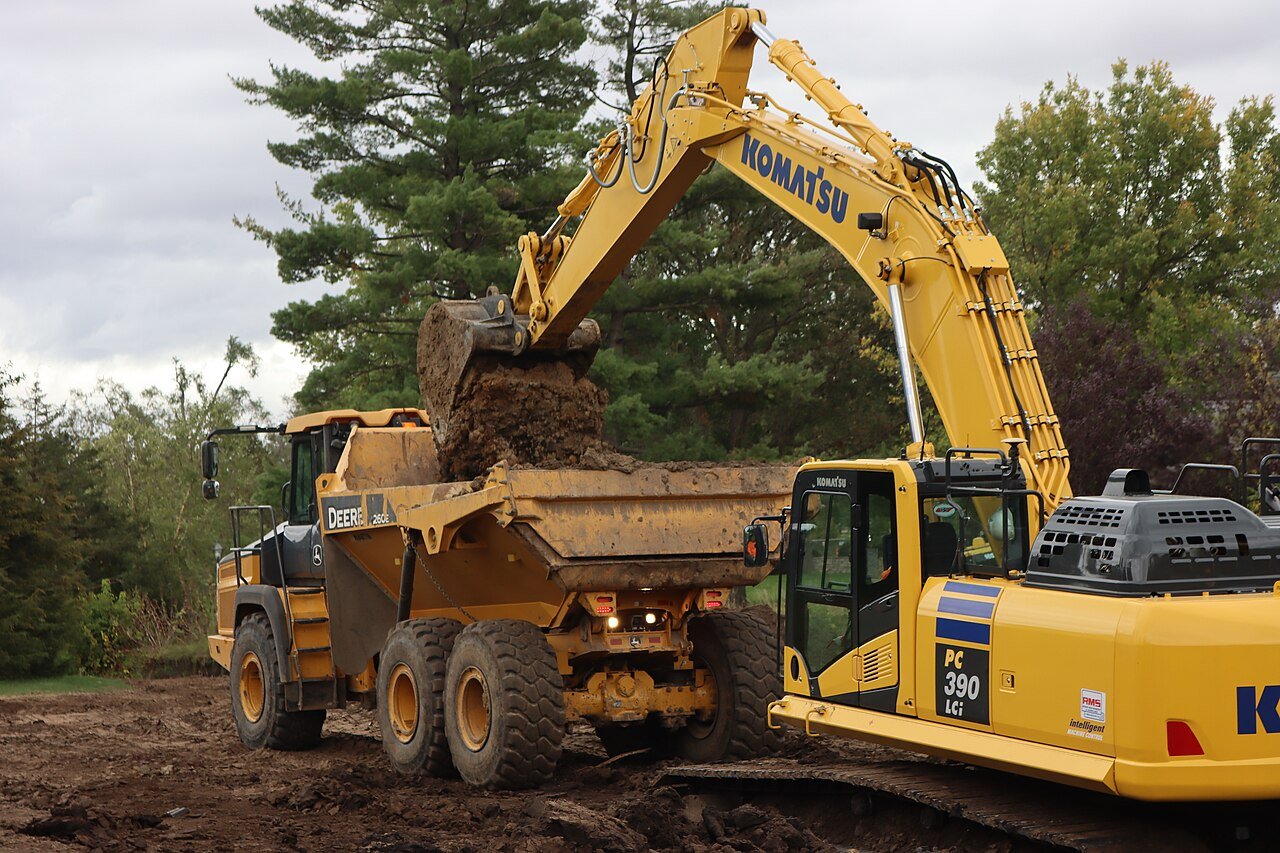
Check mass as well as volume: wet clay or rock can reach the truck’s legal payload before the body is full. On site I compare truck counts with a weekly survey of the cut. Loads × loose volume per load ÷ surveyed bank volume is the real bank-to-loose factor for that material.
Mass haul diagram: a short introduction
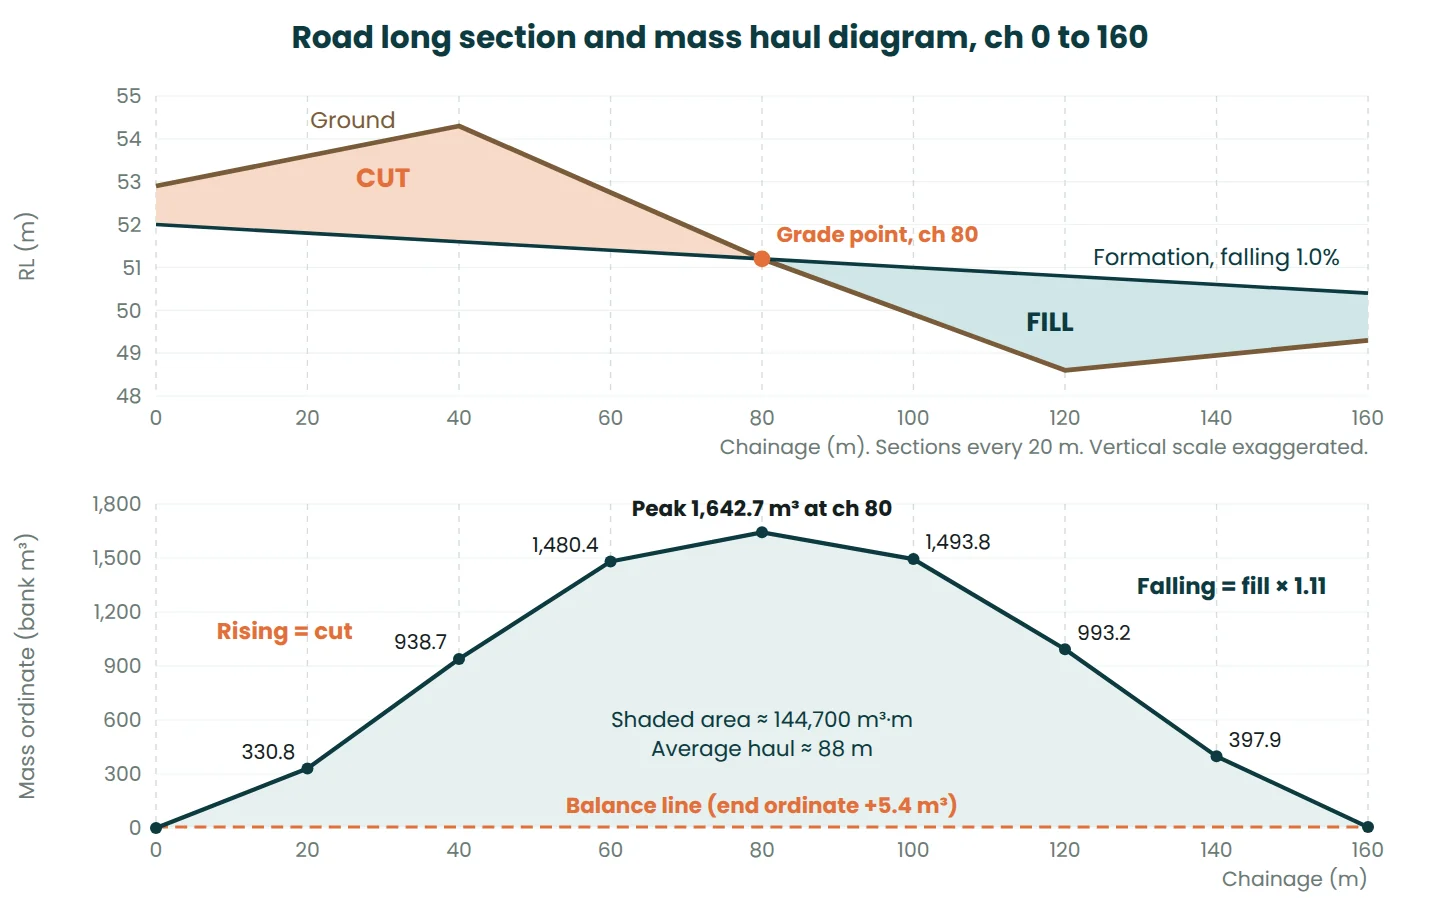
A mass haul diagram plots the running net volume against chainage: cut adds and fill (converted to bank) subtracts. For the road it is the last column of the volume table, drawn under the long section above.
- A rising line is cut and a falling line is fill.
- A peak is a change from cut to fill (chainage 80, 1,642.7 m³). A trough is a change from fill to cut.
- A horizontal line that cuts the curve twice is a balance line: between those points the cut exactly builds the fill.
- The last ordinate is the overall surplus or shortfall, +5.4 m³ here.
- The area between the curve and a balance line is the total haul in m³·m. Divide by the volume moved for the average haul distance.
Here that is about 144,700 m³·m ÷ 1,637 m³ ≈ 88 m. Haul distance, not volume alone, sets the plant and the cost. Some contracts include a free-haul distance in the excavation rate and pay haul beyond it as overhaul.
Common mistakes
- Mixing bank, loose and compacted volumes. Survey cut is bank, design fill is compacted and truck counts are loose. Skipping the conversion turned the balanced road into a false 168 m³ surplus.
- Sections too far apart. Missing the section at the bottom of the gully cut the fill over that 40 m by 28%. Add sections at breaks in the ground and at grade points.
- Ignoring the topsoil strip. A 150 mm strip turned the balanced pad into a 193 m³ shortfall. Calculate from the stripped surface and stockpile topsoil separately.
- Centreline depths on side-long ground. A 1 in 8 cross fall added 5.2% to one section. Use two-level or full cross-sections.
- Working to the wrong level. Bulk excavation goes to the underside of the pavement, slab or base course, not finished surface level. Check which level the drawings call formation or subgrade.
- Unchecked levels. A 50 mm benchmark error shifts every depth on the pad and is worth 60 m³ over 1,200 m². Close the level run before you calculate.
Enter your own sections in the earthwork calculator to get the average end area volumes, running net and prismoidal check in one go.
Frequently asked questions
Which is more accurate, average end area or prismoidal?
The prismoidal formula. For level and three-level sections, average end area always overestimates, by about 1.5% in the road example. Closer section spacing usually improves the answer more than switching formulas.
What is the difference between swell and shrinkage?
Swell is the increase in volume when soil is dug (bank to loose), and shrinkage is the decrease from bank to compacted. Typical averages for loam are 25% swell and 10% shrinkage. To convert to truck loads, multiply bank volume by the loose factor, divide by the truck’s loose capacity and round up.
What formation level balances cut and fill on a pad?
Without shrinkage, it is the weighted mean ground level from the grid, Σ(weight × RL) ÷ Σweight. With a fill factor above 1 the level must drop a little to make more cut, about 20 mm on the example pad. Take off the topsoil strip first.
References
- Headquarters, Department of the Army (2012). TM 3-34.62 / MCRP 3-17.7I, Earthmoving Operations. Table 1-1, Material volume conversion factors.
- Wikibooks. Fundamentals of Transportation/Earthwork. Open textbook chapter on the average end area method, the prismoidal formula and mass balance diagrams.
- Wikipedia. Prismatoid. The prismatoid volume formula and its link to Simpson’s rule.
- Ghilani, C.D. and Wolf, P.R. (2018). Elementary Surveying: An Introduction to Geomatics, 15th edition. Pearson. Chapter on volumes: cross-section, average end area, borrow pit and prismoidal methods.
This article is general information for learning and planning. Always follow your project specification, the current standards and the advice of the responsible engineer.

.JPG)
Leave a Reply